Brutor AI Gateway

Intelligently forward, secure, and govern all routable AI traffic — LLMs, MCP servers, and autonomous agents — through the enforcement engine of the Brutor AI Control Plane. Every call is checked on the way through and recorded on the way out, so you can answer what your AI did, what it cost, and whether it stayed inside the rails.
One enforcement point for every AI traffic type Rust proxy with no detectable latency cost at tested concurrency Native MCP, native A2A v1.0, OpenAI-compatible Drop-in — on-prem, private cloud, or Brutor SaaS
Brutor AI Gateway overview: on the left the Portal, AI Systems and coding agents all call in; in the middle the Brutor AI Gateway handles model routing, governance, compliance, the assurance lifecycle and logging; on the right it fronts models across 39 providers, MCP servers, skills and A2A agent peers
/the gap it fills/

Between your code and the model vendor, nothing is watching.

An AI call is an outbound HTTPS request, made by application code straight to a vendor API. Your load balancer, ingress controller and API gateway all sit in front of traffic arriving at your services — none of them is on the path of traffic leaving them. An egress proxy or firewall does see the connection, but only as a TLS session to api.openai.com: not the prompt, not which model answered, not what it cost, not which tool the agent just invoked. Every provider SDK opens its own connection with its own key and goes. Three questions stop being answerable:

“Who asked for this?”

Every team shares one provider key, so every request looks identical at the vendor — no answer, and no way to stop just that one thing.

“What did this task involve?”

One agent task = dozens of calls across models and tools. Per-request logs record all of them and explain none of them.

“Is it still working?”

An agent taking twelve steps where it used to take four throws no error, and costs four times as much. Nothing pages. Uptime stays green.

The Brutor AI Gateway is that missing hop. One address every AI call goes to instead of the vendor, where the controls actually run and every call is recorded on the way out. Here is what sits on it, end to end:

Brutor AI Gateway architecture: everything that calls AI enters one governed hop where controls are enforced and every call is recorded, in front of the models, MCP servers, skills, knowledgebases and agents it reaches

Everything that calls AI · one enforced, recorded hop · every resource it reaches. The rest of this page is what happens on that hop. Explore the full architecture →

/why brutor’s gateway/

Four reasons this one, and not another.

Assurance

Most gateways stop at the call. Yours shouldn’t.

Checking each request still tells you nothing about whether the agent behind it is behaving. Brutor groups calls into runs, learns what normal looks like for each AI System, and raises a finding when that changes — drift, silence, a cost curve bending — on the day it happens, not at the next audit.

See the assurance layer
One Control Plane

Every AI traffic type, one policy model.

Models, MCP tools, Skills, knowledgebases and agent-to-agent calls all pass the same enforcement point — one set of limits, one approval queue, one audit trail. Not an LLM proxy with tool governance bolted on beside it.

Explore the capabilities
Fail-closed

When a control can’t run, the call doesn’t either.

If a guardrail provider times out or a policy judge is unreachable, Brutor refuses the request rather than waving it through. Guardrails and semantic policies fail closed by default — with retry, circuit-breaker and local-fallback stages before the deny, and an expiring break-glass for when you genuinely need one.

How guardrails behave
Performance

Fast enough that nobody asks to switch it off.

Governance gets disabled when it costs latency. Brutor’s full pipeline — auth, RBAC, routing, guardrails, quotas, cache — measured statistically indistinguishable from calling the model directly. And it stays yours: OpenAI-compatible, native MCP and A2A, on-prem or private cloud, with no lock-in on the way out.

See the benchmark
/core capabilities/

Brutor AI Gateway capabilities

Assurance comes first, because it is the reason for the rest. Everything after it — the AI services the gateway routes, the governance it enforces, and the operations that keep it running — exists so that the assurance layer has something true to say about your AI Systems.

//Assurance Layer//

Proof it still behaves — every day it runs in production.

This is what the rest of the gateway is for. Traditional monitoring watches the calls; an AI System changes in the behaviour between them. Everything that follows — the models, the tools, the policies, the logs — exists so this layer has something true to say.

01

AI Systems Assurance

Deployed is not done. Prove each AI System still does what you shipped — not just on day one, on day 201.

The unit is a run, not a request

Every task recorded as a run

The calls that make up one task — across models, tools, skills and delegated agents — are grouped into a single run with an honest terminal state. That is the unit owners and auditors actually ask about.

Signals, learned per system

Cost per completed run, trajectory length, tool errors and outcome mix, each with its own history. Not thresholds you guessed — the system’s own normal, learned from what it did.

Including what nothing produced

Spend on runs that errored, were abandoned or exhausted their budget is called out separately. Money burned without an answer is the number no per-request dashboard shows you.

Liveness — the absence signal

The only signal that fires when traffic stops. A system that goes quiet, stalls or collapses in volume raises an alert, even though nothing errored and uptime stayed green.

Drift with a cause, or none claimed

Behaviour is compared against the system’s own baseline and changes are flagged with the likely reason — a model updated, a tool definition changed. “Unexplained” is reported as unexplained, never guessed.

Health that refuses to round up

One worst-of score per system, always decomposable into the signals behind it. A system with too little evidence is scored unknown, never green.

Every governed call — LLM, MCP, skill and A2A — is grouped by task into the run ledger, where each run gets an honest terminal state. Baselines learn what normal looks like per system, and a version-hashed contract records what the system declared at sign-off. Runs, baselines and the contract feed six continuously scored signals: liveness, behaviour, reliability, cost, conformance and oversight. The six combine worst-of, never averaged, into one health verdict reading healthy, degraded, drifting, silent or unknown. The verdict drives the fleet board, findings and automatic response, and the assurance report — which ends by stating what it does not cover. Recorded runs are also replayable offline.
Watch it, and see why

Signals with their own graphs

Each signal shows its current figure, its distribution and its shape over time — so “cost went up” is immediately either a step change, a slow drift, or one bad afternoon.

A cadence you can propose from evidence

Rather than asking you to invent a liveness expectation, Brutor can suggest one from the runs it has already observed — and shows plainly when the detector has not evaluated a system yet.

Every run, and every step inside it

Open the ledger to find the runs that matter, then open one to see the actions it took in order, with what each cost and what it returned.

The Signals tab of a Brutor AI System: a liveness expectation with mode, last run, quiet-for duration and a button to suggest a cadence from observed runs; cost per completed run with median, p95 and spend that produced nothing, charted over time; trajectory length with median, p95 and max actions and an exhausted rate, with a distribution histogram; tool errors with call count, error count and rate over time; and run outcomes split into completed, completed degraded, errored and abandoned.
The Trajectory tab of a Brutor AI System, split into finding actions across runs on the left and inspecting a single run's ordered steps on the right.
Bind it to a contract

A contract is generated, never authored

A hash-pinned snapshot of every control that resolves onto the system — models, MCP servers, skills, guardrails, policies, limits, autonomy. A policy document that can disagree with reality is worse than none.

You can read what was signed

Each version expands to show exactly what it froze, with inherited grants marked as such — because a v1 has no predecessor and therefore no diff, and nobody should approve a hash whose body they cannot see.

Enforced ceilings and graded bounds

Per-run ceilings on cost, model calls, tokens, delegation depth and wall-clock are checked at the gateway before every call. Window bounds — average cost per task, completion and error rates — are graded in the report and never refuse a call.

Stamped on every run

Each finished run records the contract it ran under, so “what governed this?” has a provable answer months later, and conformance is measurable rather than assumed.

Replay before you promote

Freeze a stratified suite from recorded traffic and rehearse a policy change against it offline — nothing dispatched upstream. Your audit log becomes an eval set, with no extra instrumentation.

Automatic response when it drifts

Arm a policy to downgrade autonomy, tighten a limit or suspend a system while a human investigates — with a blast-radius preview first, and a one-click restore after.

The Contract tab of a Brutor AI System: contract lifecycle with promote and deprecate transitions and their requirements; a version expanded to show what it covers — the resources it may use, the policies in force with inherited ones marked, merged limits and governance, and autonomy inherited through the group chain — frozen at mint time and pinned by hash; an operating envelope split into enforced per-run ceilings for cost, model calls, tokens, delegation depth and wall-clock, and graded bounds measured over the window; an evidence panel; and a replay suite panel alongside.
And hand someone the report

A verdict in words, not a score

Assured, conditionally assured or not assured, with what we know, what prevents full assurance, the recommended action, and why any of it matters — readable by someone who has never seen the product.

It states what it does not cover

Unmeasured is reported as unmeasured, never as a pass. A verdict measured against a system’s own history rather than an approved bound says exactly that, in the verdict itself.

An evidence maturity ladder

Observable, baseline established, controlled, evidence-backed, independently assured — with the specific thing blocking the next rung, and what to do about it.

Learned baselines, shown as learned

Every baseline carries how many runs it rests on and whether it is ready or still learning — so nobody mistakes a fortnight of data for an established norm.

Recommended controls, ranked

The report ends with what to do next, ordered by what would move the verdict — mint a contract, bind a replay suite, arm a response policy, revoke unused grants.

Snapshot it, or export it

Capture an immutable point-in-time snapshot, or export the whole thing as a signed certificate, JSON or PDF for whoever asked.

The Assurance tab of a Brutor AI System: an assurance status of conditionally assured with what we know, what prevents full assurance listed as specific open items, a recommended action and why it matters; five evidence dimensions each marked pass, warning or fail; the health verdict decomposed into its six signals with relaxations disclosed; an evidence maturity ladder from observable to independently assured showing the current rung, the blocker and what to do; learned baselines each with its run count and a ready or learning state; and ranked recommended controls.
The Runs tab of a Brutor AI System: the run ledger listing each task as a run with its terminal state, cost, action count and the contract version it ran under.

Everything below this card — the models, the tools, the skills, the policies, the limits, the logs — is what makes the answers above possible. The full story lives on Agents, with the mechanisms shown end to end in the video series.

//AI Layer//

The AI services Brutor routes.

Every model, tool, skill, knowledge base, and agent your team relies on — routed through one governed front door.

02

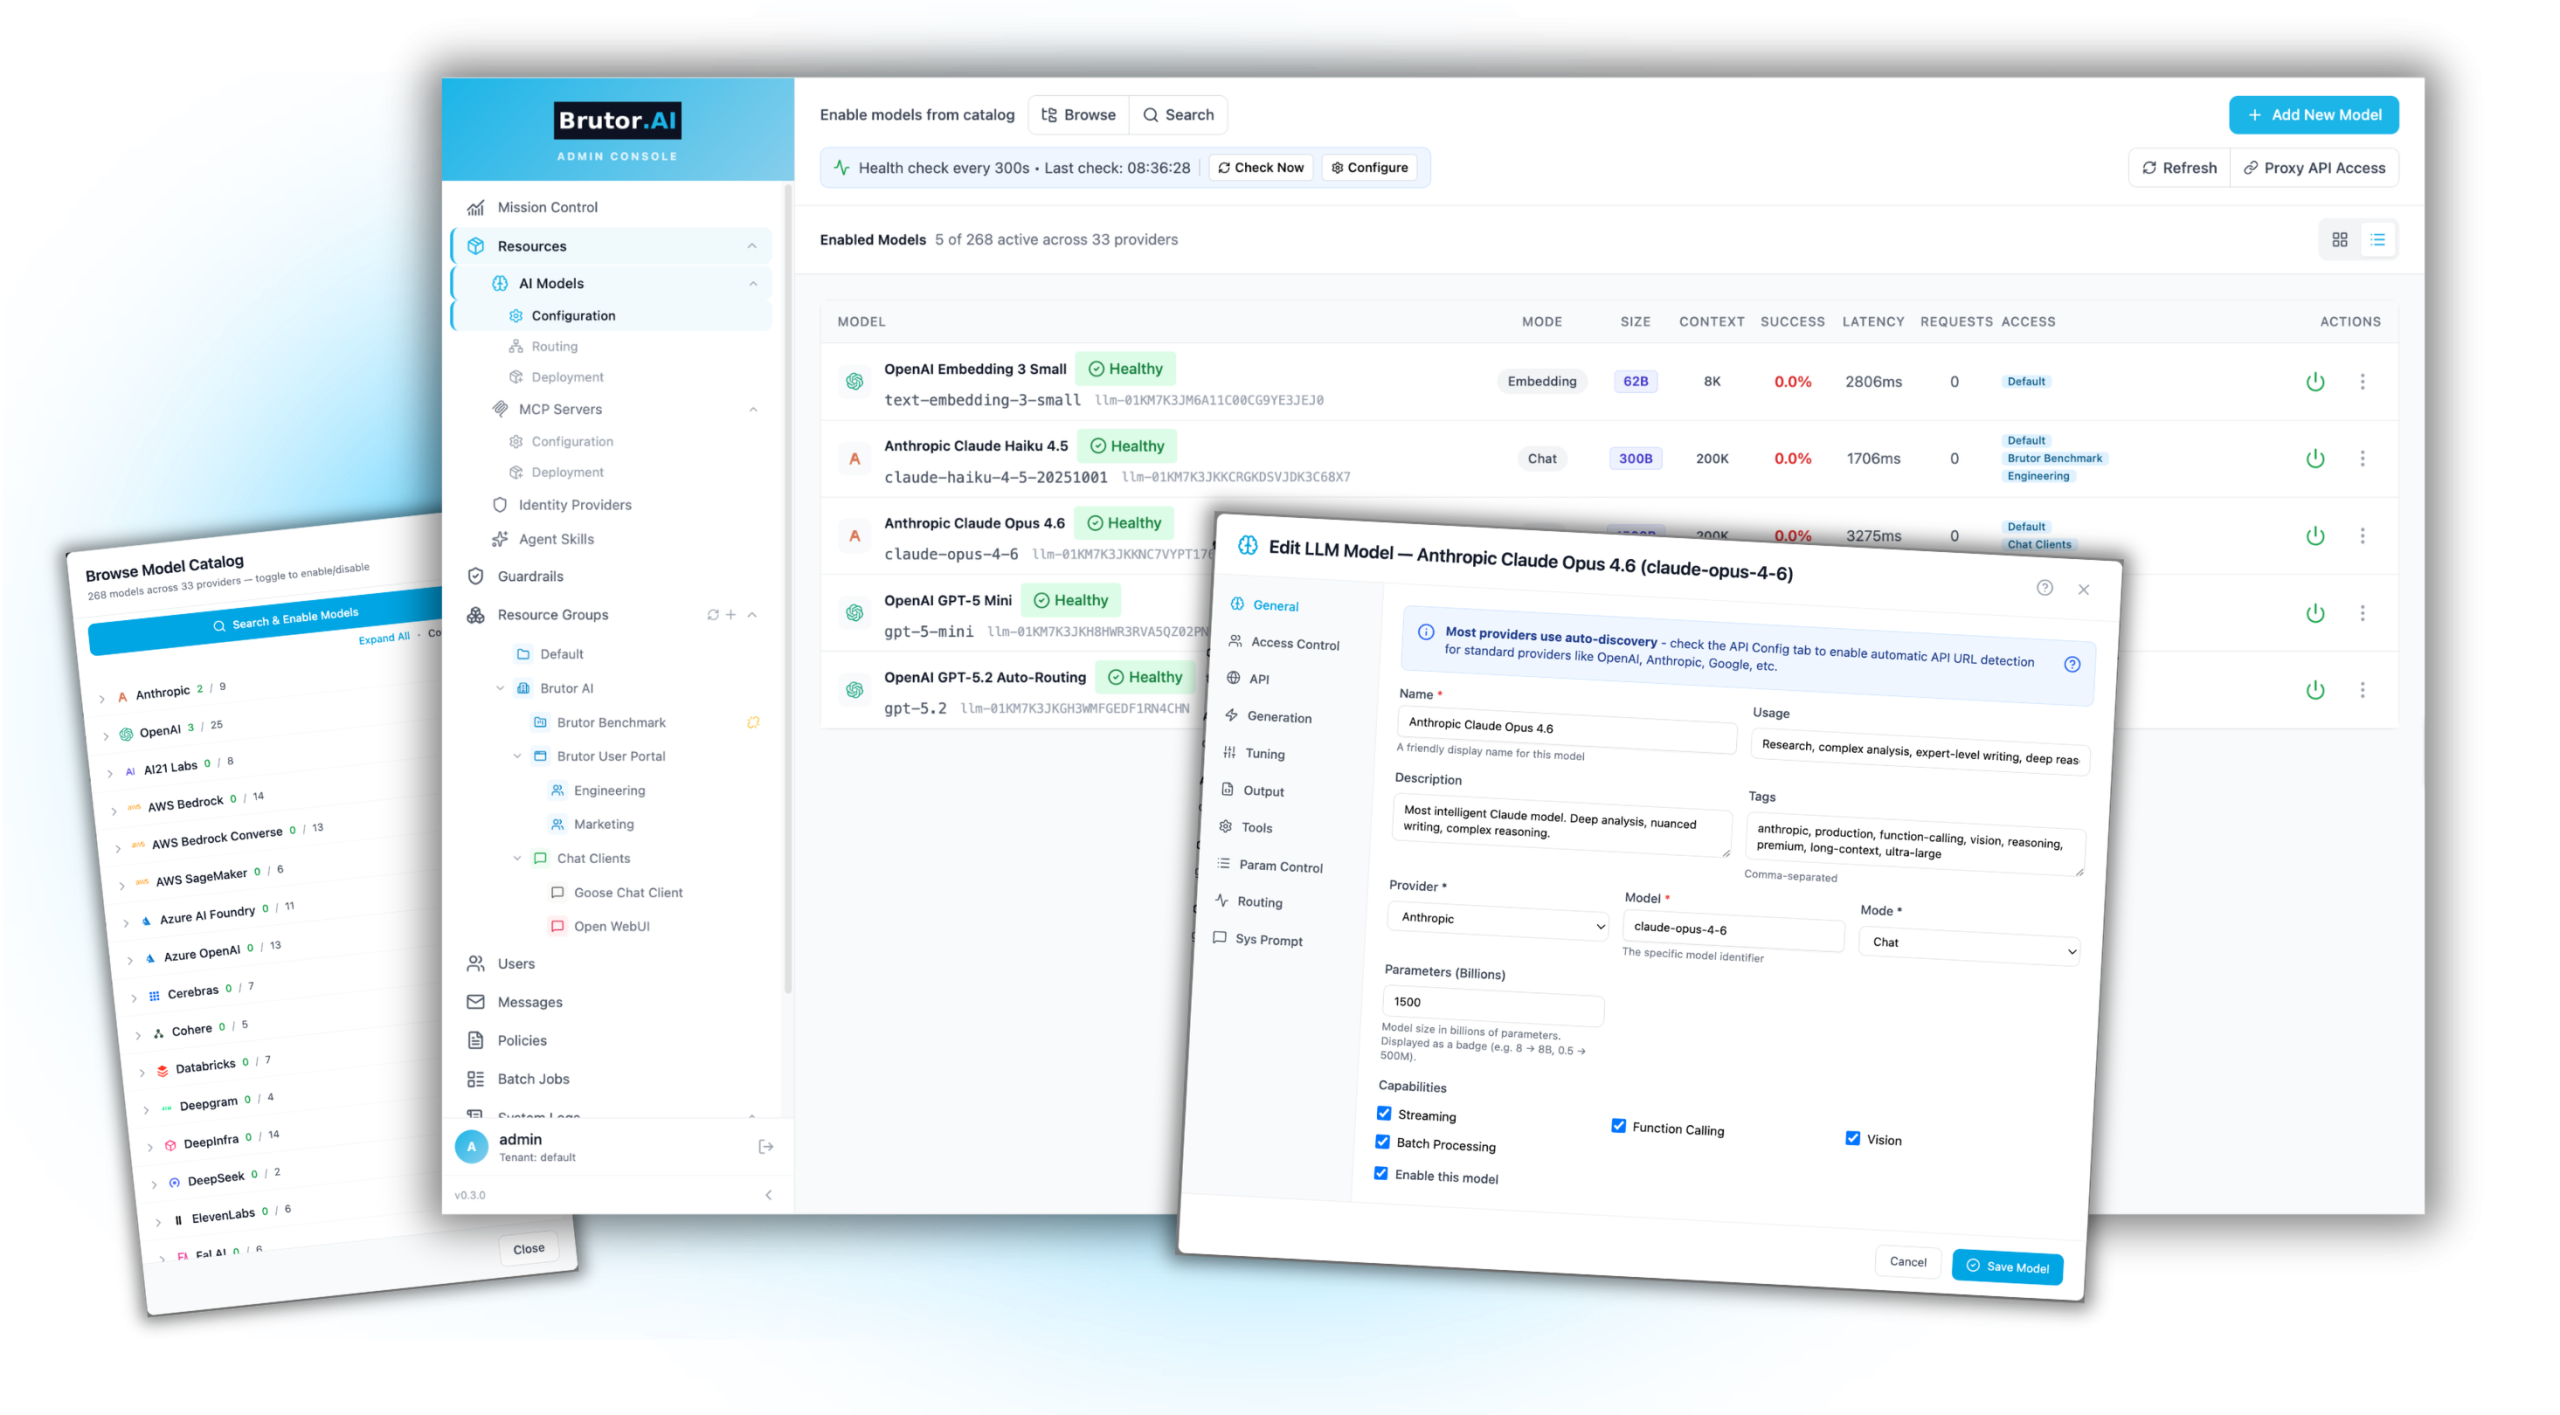
Model Management

One API for every model and every modality — with the price list, the failure handling and the keys already in place.

One API, every model

311 preconfigured models across 39 providers, plus self-hosted Ollama, vLLM and KServe. Text, image, voice, transcription and video through the same endpoint.

Anthropic Messages API, natively

/v1/messages and token counting served directly, so Claude-native SDKs and agent frameworks point at Brutor unchanged.

Batch API

Thousands of requests submitted asynchronously at provider batch rates — up to 50% below on-demand.

The catalog ships with the price list

Per-token, per-image, per-minute and per-second rates on every model, so budgets, caps and cost-based routing work on real numbers.

Import from Hugging Face

Search the Hub inside the admin console and pull a model’s configuration straight into your catalog.

Central model defaults

Temperature, top-p and max tokens set per model, so every team gets consistent behaviour without per-call tweaking.

Resilience built in

Per-model circuit breakers, connect timeouts, retries and fallback chains. One provider having a bad day doesn’t take your apps down.

Model lifecycle management

Provider retirement dates tracked per model, with advance operator alerts, so a vendor sunsetting a model never surprises production.

Secure API key vault

Provider keys encrypted at rest, managed centrally, never exposed to users or to client-side code.

How an agent reaches a model through the Brutor AI Gateway: a POST to /v1/chat/completions passes six checks in order — authenticate, resolve model, access check, quotas and ceilings, governance, input guardrails — then a cache lookup, the provider call made with a vaulted key, and output guardrails on the way back. Every call becomes one log row; log rows sharing a task id become one run in the run ledger, which is what baselines, drift and assurance are computed from.
03

Model Routing

One name your clients keep calling while the fleet changes underneath — and no way for routing to hand out access you never granted.

A routing group is just a model name

Clients call one name; the group picks the real model. Change the fleet, change no client code.

One group, many providers

Mix OpenAI, Anthropic and self-hosted models in a single group, and move traffic between them by config.

Five selection strategies

Weighted random, least busy, lowest usage, lowest latency or lowest cost. Set per group, changed without a redeploy.

Failure is a fallback, not an error

A 429, 5xx or timeout retries the same request down the chain, and the model that failed goes into cooldown until it recovers.

Context-window fallback

A prompt too long for the chosen model is re-routed to one that fits, instead of failing back to the caller.

Rate limits are part of the decision

Per-model RPM, TPM and concurrency are checked while selecting, so the router routes around a saturated model.

Health checks keep the pool honest

Unhealthy models are excluded automatically on a configurable interval, and returned when they recover.

Routing can never widen access

Every model in a group must be granted to the calling resource group in its own right. A group is a convenience, never a back door.

Every route governed and recorded

The same guardrails, budgets and quotas apply whichever model is picked, and the log names the one that actually served the call.

Brutor AI Gateway model routing: one model name enters a governed hop where identity, RBAC, budget and input guardrails are checked; eligibility filters for access, cooldown and health, rate limits and context window decide which models may serve it; one of five strategies picks from the survivors; failures fall back down the chain into cooldown or a bigger-context model; and the response leaves through output guardrails with spend recorded against the calling group
04

MCP Server Governance

Govern every tool your AI connects to — what exists, what a call is allowed to do, and who has to say yes.

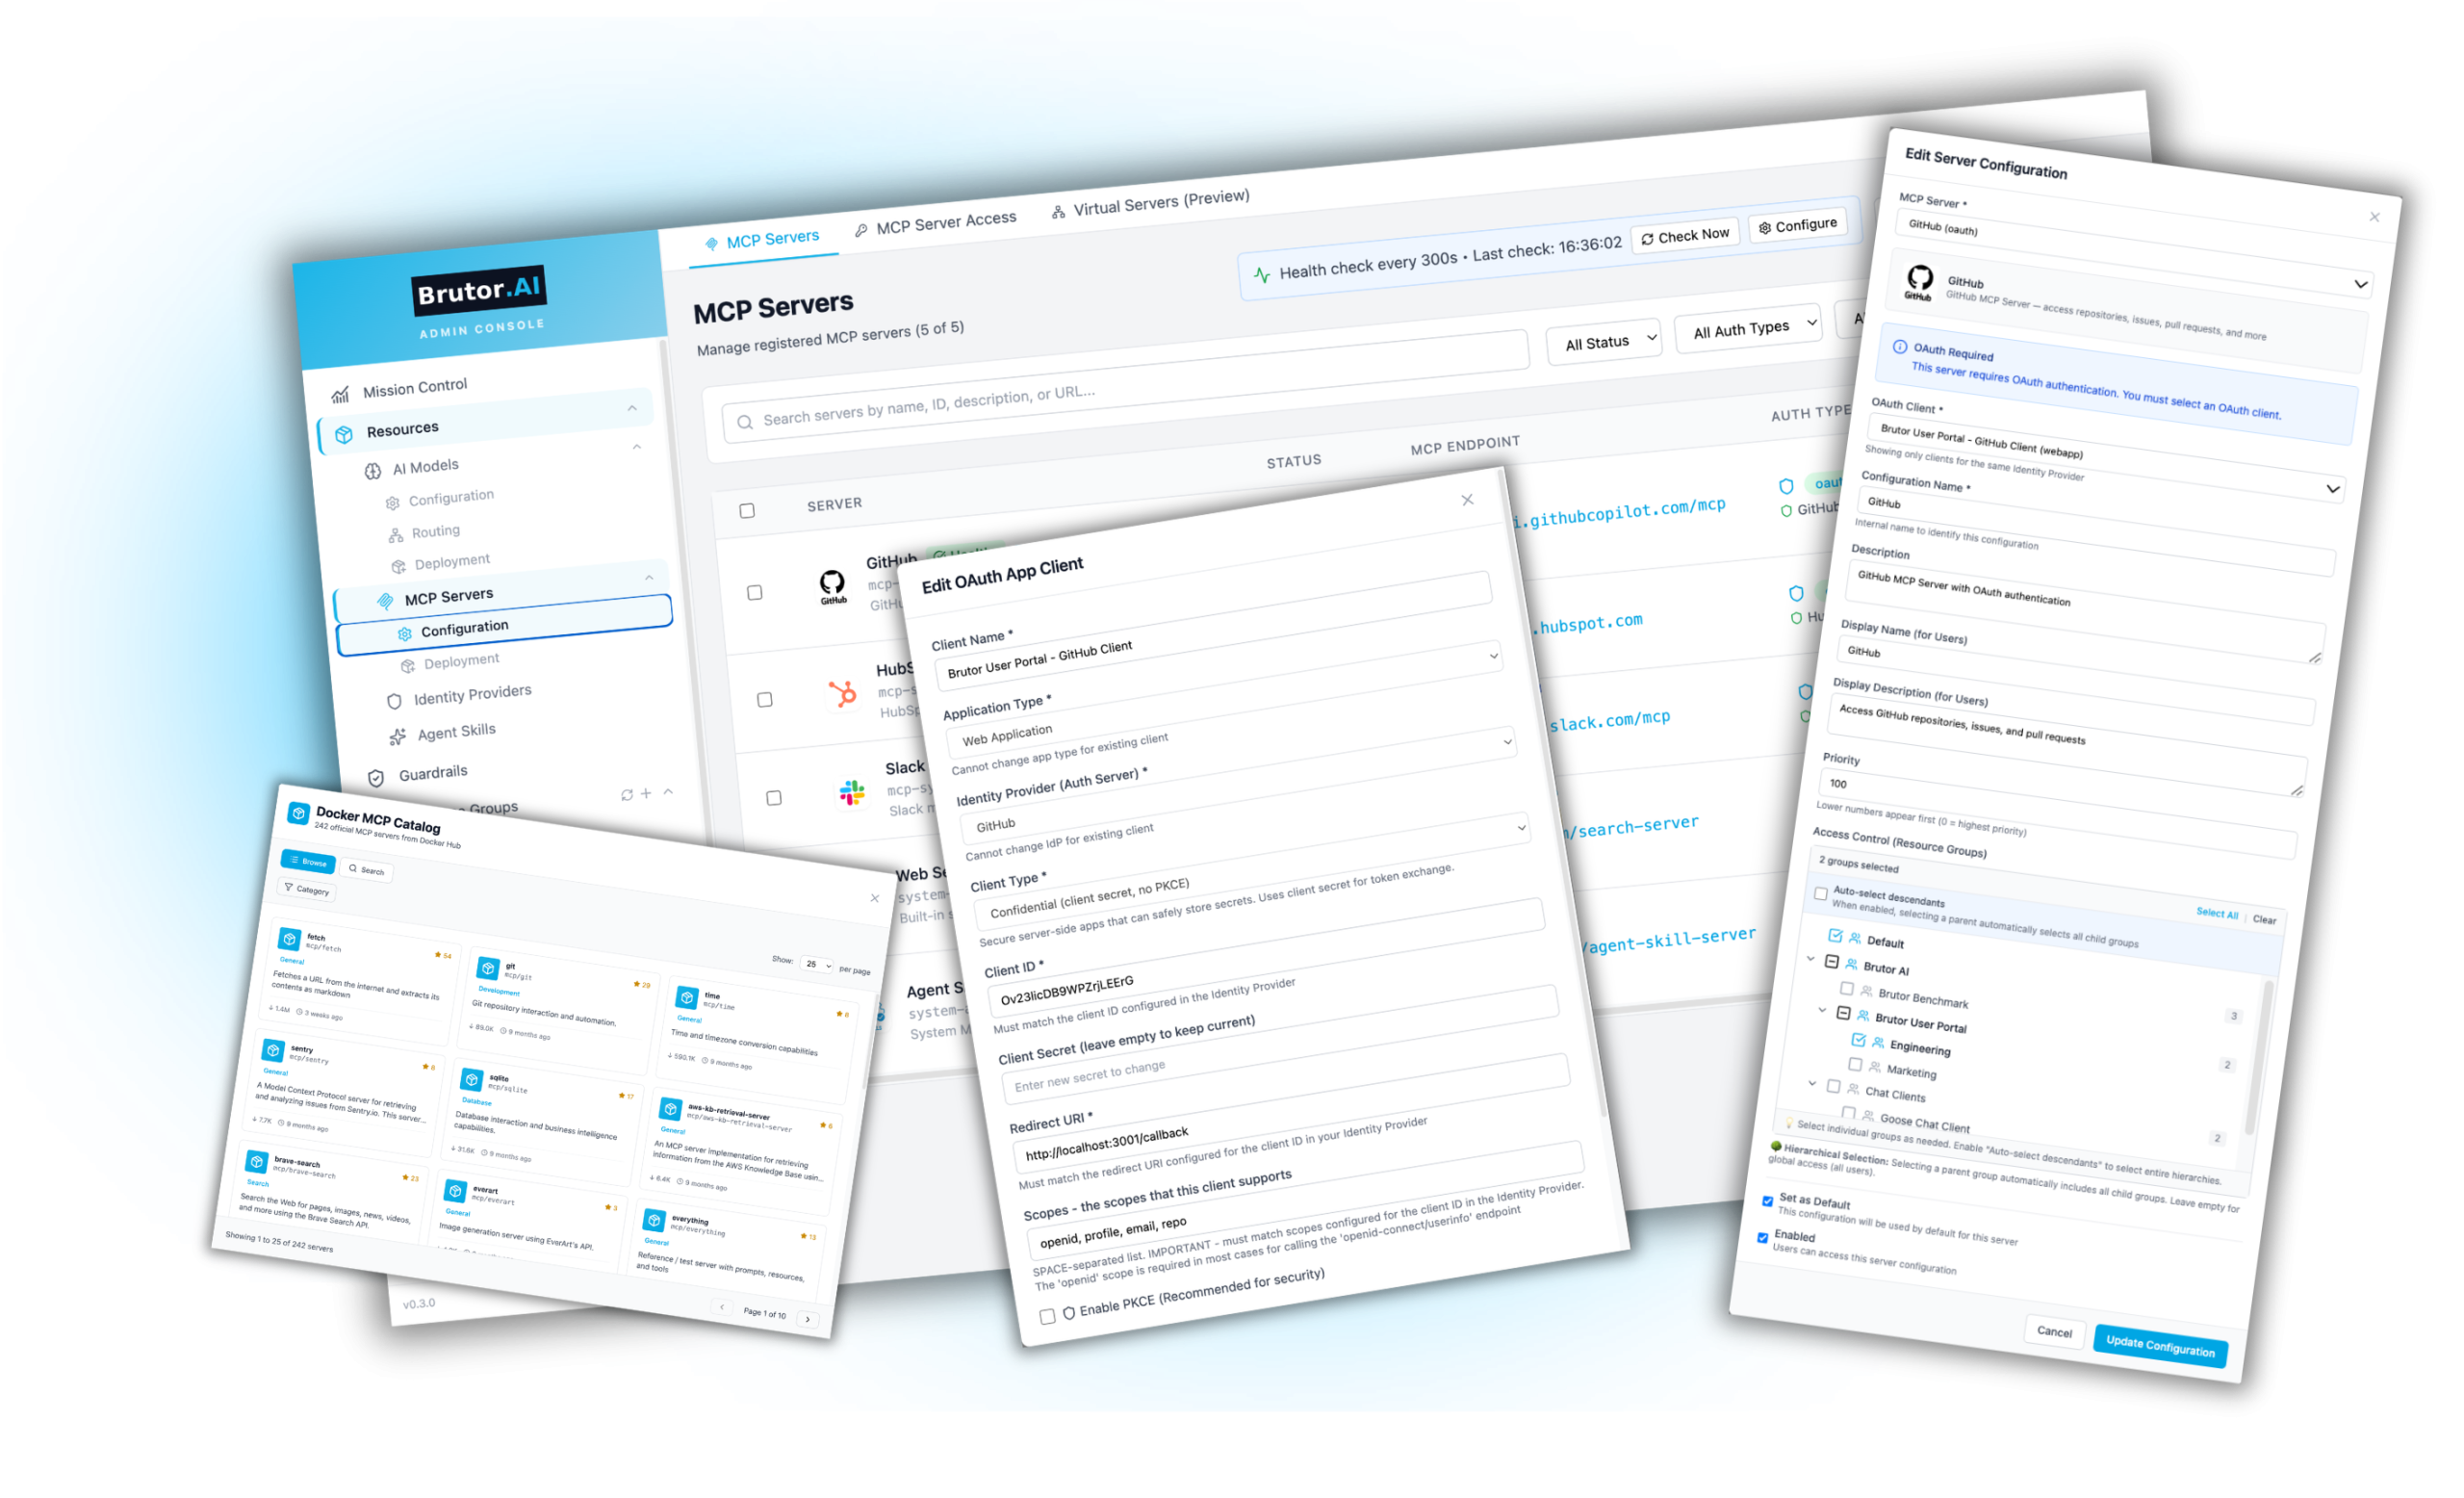
80+ MCP servers out of the box

GitHub, HubSpot, Slack, Snowflake, Asana, Atlassian, AWS, Postgres, Terraform and more — one-click enable, with images mirrored to Brutor’s own registry so production never depends on an external one.

Bring your own

Any Docker image, GitHub repo or remote MCP URL. Mix containerized and remote servers in one governed catalog, Kubernetes-ready for production.

Virtual MCP aggregation

Combine tools from many servers behind one endpoint, with per-group filtering and tool renaming. Agents see one clean toolbox; you keep per-server control.

Enterprise MCP Registry (Beta)

A standalone registry on the official MCP registry spec: federate public servers, publish your own, attach governance metadata to every record.

OAuth proxy

Authentication handled automatically for every OAuth-protected server. Access tokens stay encrypted at the Gateway, never exposed to clients.

Capability filtering

Enable individual tools, resources, prompts and resource templates per resource group. A capability that isn’t enabled doesn’t exist for that group.

Three-state tool approval

Each tool is enabled, approval-required (blocks pending human review) or disabled. Auto-approve the trusted ones; gate the actions that need a human.

Guardrails on both sides

Arguments scanned on the way in for PII, secrets and prompt injection; results scanned on the way back before they reach the agent, including mid-call elicitation prompts.

Argument and semantic policies

Deterministic SQL, URL, shell, path and JSON analyzers that warn or deny on what a call would do, plus a plain-English rule an LLM judge evaluates. Shadow first, then enforce.

Limits at group, server and tool scope

Token bucket, fixed-window quota and cooldown per tool, on top of daily call and budget caps merged up the group’s ancestors. Only real tool calls consume budget.

Data residency per server

A server’s region is checked against the tenant’s residency profile before it is reached, and a refusal is written to the audit trail with its reason.

Every tool call recorded

One log row naming who called, which server, which tool and the decision. Calls sharing a task id become one run in the run ledger.

What happens when an agent calls a tool through the Brutor AI Gateway: a tools/call request settles access and cost first — authenticate, server access, quotas, rate limits, data residency — then five independent policy controls decide what the call may do: capability filter, guardrails, semantic policy, argument policy and human approval. Only then does the OAuth proxy attach a vaulted token, the MCP server run the tool, and output guardrails scan the result. Every call becomes one log row feeding the run ledger.
05

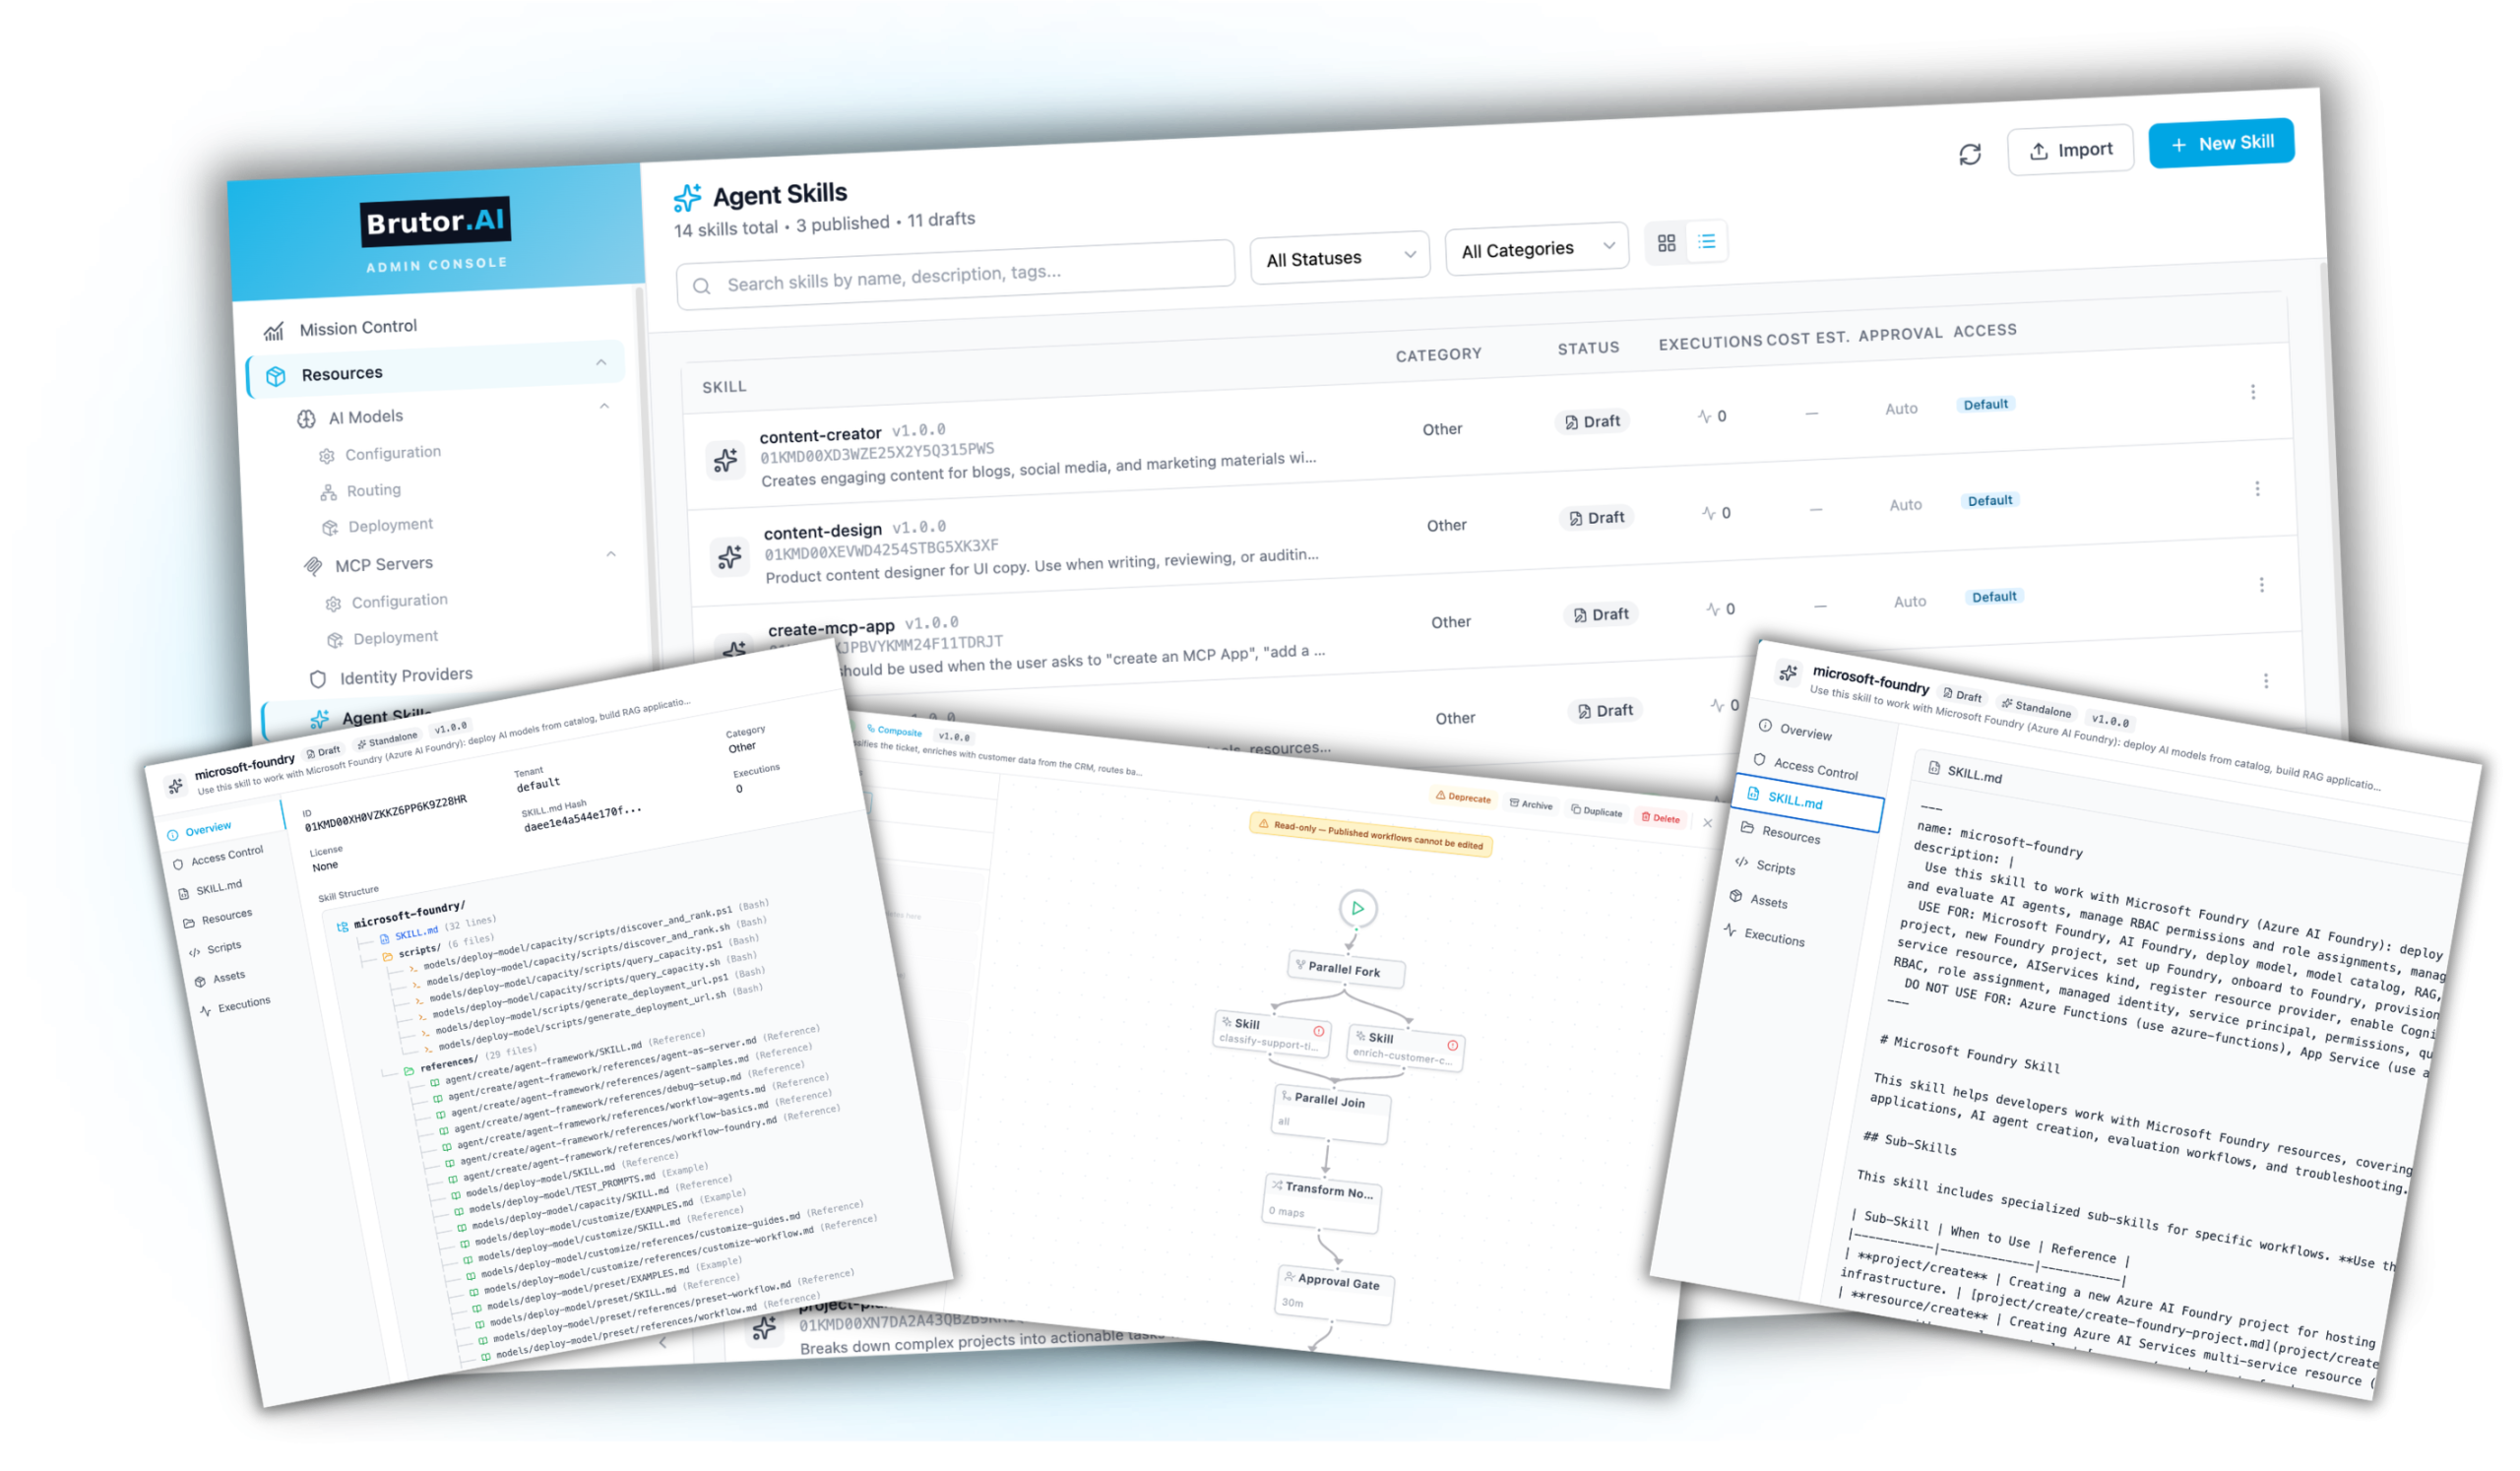
Skills for procedure & process

Encode how your organization actually does things — and let an agent follow it, one governed step at a time.

Encode your processes as a unit

A skill packages instructions (SKILL.md), scripts, reference files and templates into one versioned, governed bundle — the procedure, not just a prompt.

Progressive disclosure over MCP

Agents discover the catalog, load full instructions only when needed, then act step by step. A skill costs roughly 50–100 tokens of context until it is actually used.

Works from any MCP client

Claude Code, IDE plugins, Goose or your own agent — the same three levels, with no Brutor SDK to adopt.

The bundle never leaves the platform

Agents receive instructions, reference content and script output — never the code itself.

Scripts run in Brutor’s sandbox

No network exposure, a read-only filesystem and a hard timeout. Execution happens on the platform, not inside the agent.

Every step governed independently

Guardrails on skill input and output, argument policies, per-skill quotas and human approval gates — on each action. No “approved once, trusted after.”

Access by resource group

Skills are assigned to groups, not to individuals. A skill the caller’s groups don’t allow never appears in their catalog at all.

Versioned and immutable

Skills move through draft → validated → published → deprecated → archived. A published version never changes, so callers always know what they’re running.

Author in the UI or sync from GitHub

Keep skill bundles in a repo and publish them through review, or write them directly in the Admin UI.

Progressive disclosure for Agent Skills across three governed levels: L1 discover returns only the skills the caller's groups allow, roughly 50-100 tokens each; L2 load returns the full SKILL.md instructions and a manifest of what the skill may read, run and render, with nothing executing and the load written to the audit trail; L3 act runs read_resource, run_script and render_template one step at a time, each step re-governed with guardrails, argument policy, per-skill quota, approval and audit. The bundle never leaves the platform: scripts run sandboxed with no network, a read-only filesystem and a hard timeout.
06

Agent Identity & Agent-to-Agent

An agent is a principal you can name, permission, time-box and revoke — before it ever calls a model, a tool, or another agent.

Agent identity & policy

A principal, not a shared key

Every agent gets its own agent-<ULID>, a named human owner, and an optional anchor to your IdP — so a workload claim resolves to a governed identity you can hold to account.

Default-deny

A newly created agent can call nothing at all until a grant says otherwise. Nothing is inherited from a group, and nothing is implied.

Grants per action, per target

Written against llm_call, mcp_tool, a2a_call or skill_exec, each scoped by a glob over the model, tool, agent card or skill it covers.

Allow, deny, or ask a human

The third effect routes into the same approval queue your people already answer — so an agent’s riskiest actions get a reviewer, not a refusal.

Constrained and time-boxed

A grant can carry a time window, a maximum delegation depth, a rate and its own expiry. Identities carry a TTL and revoke in one click.

Dry-run before you enforce

Run an agent in dry-run and Brutor records what would have been blocked, without blocking it. Flip to enforce once the log is clean.

An agent identity is a principal with its own agent-ULID, a named human owner, an IdP anchor, a time-to-live and one-click revocation. Every agent is default-deny. Grants are written per action type — LLM_CALL, MCP_TOOL, A2A_CALL, SKILL_EXEC — each scoped by a target glob and carrying an effect of allow, approval-required or deny, plus constraints for time window, max delegation depth, rate and expiry. At call time the decision is allowed, approval required, or denied; dry-run mode records what would have been blocked without blocking it.
Agent-to-agent (A2A)

Native A2A v1.0

The full open standard, implemented in the Gateway with no vendor extensions — inbound and outbound, both governed.

Signed Agent Cards

Published at /.well-known/agent-card/{tenant}/{name}.json, Ed25519-signed so a third party can verify them, and RBAC-filtered per caller.

Signed delegation chains

Every multi-hop call carries HMAC provenance, so a hop cannot be spoofed — and depth is capped per group and per card, with a hard ceiling above that.

Full task lifecycle

SSE token streaming, the complete task state machine, and per-task push notification configs for work that outlives the connection.

Per-card rate limits

Frequency caps per resource group and tenant-wide per agent card, so one chatty partner agent can’t exhaust your capacity.

The same rails as every other call

Same RBAC, budgets, guardrails and audit — no second control plane. A2A spend attributes back to the calling team.

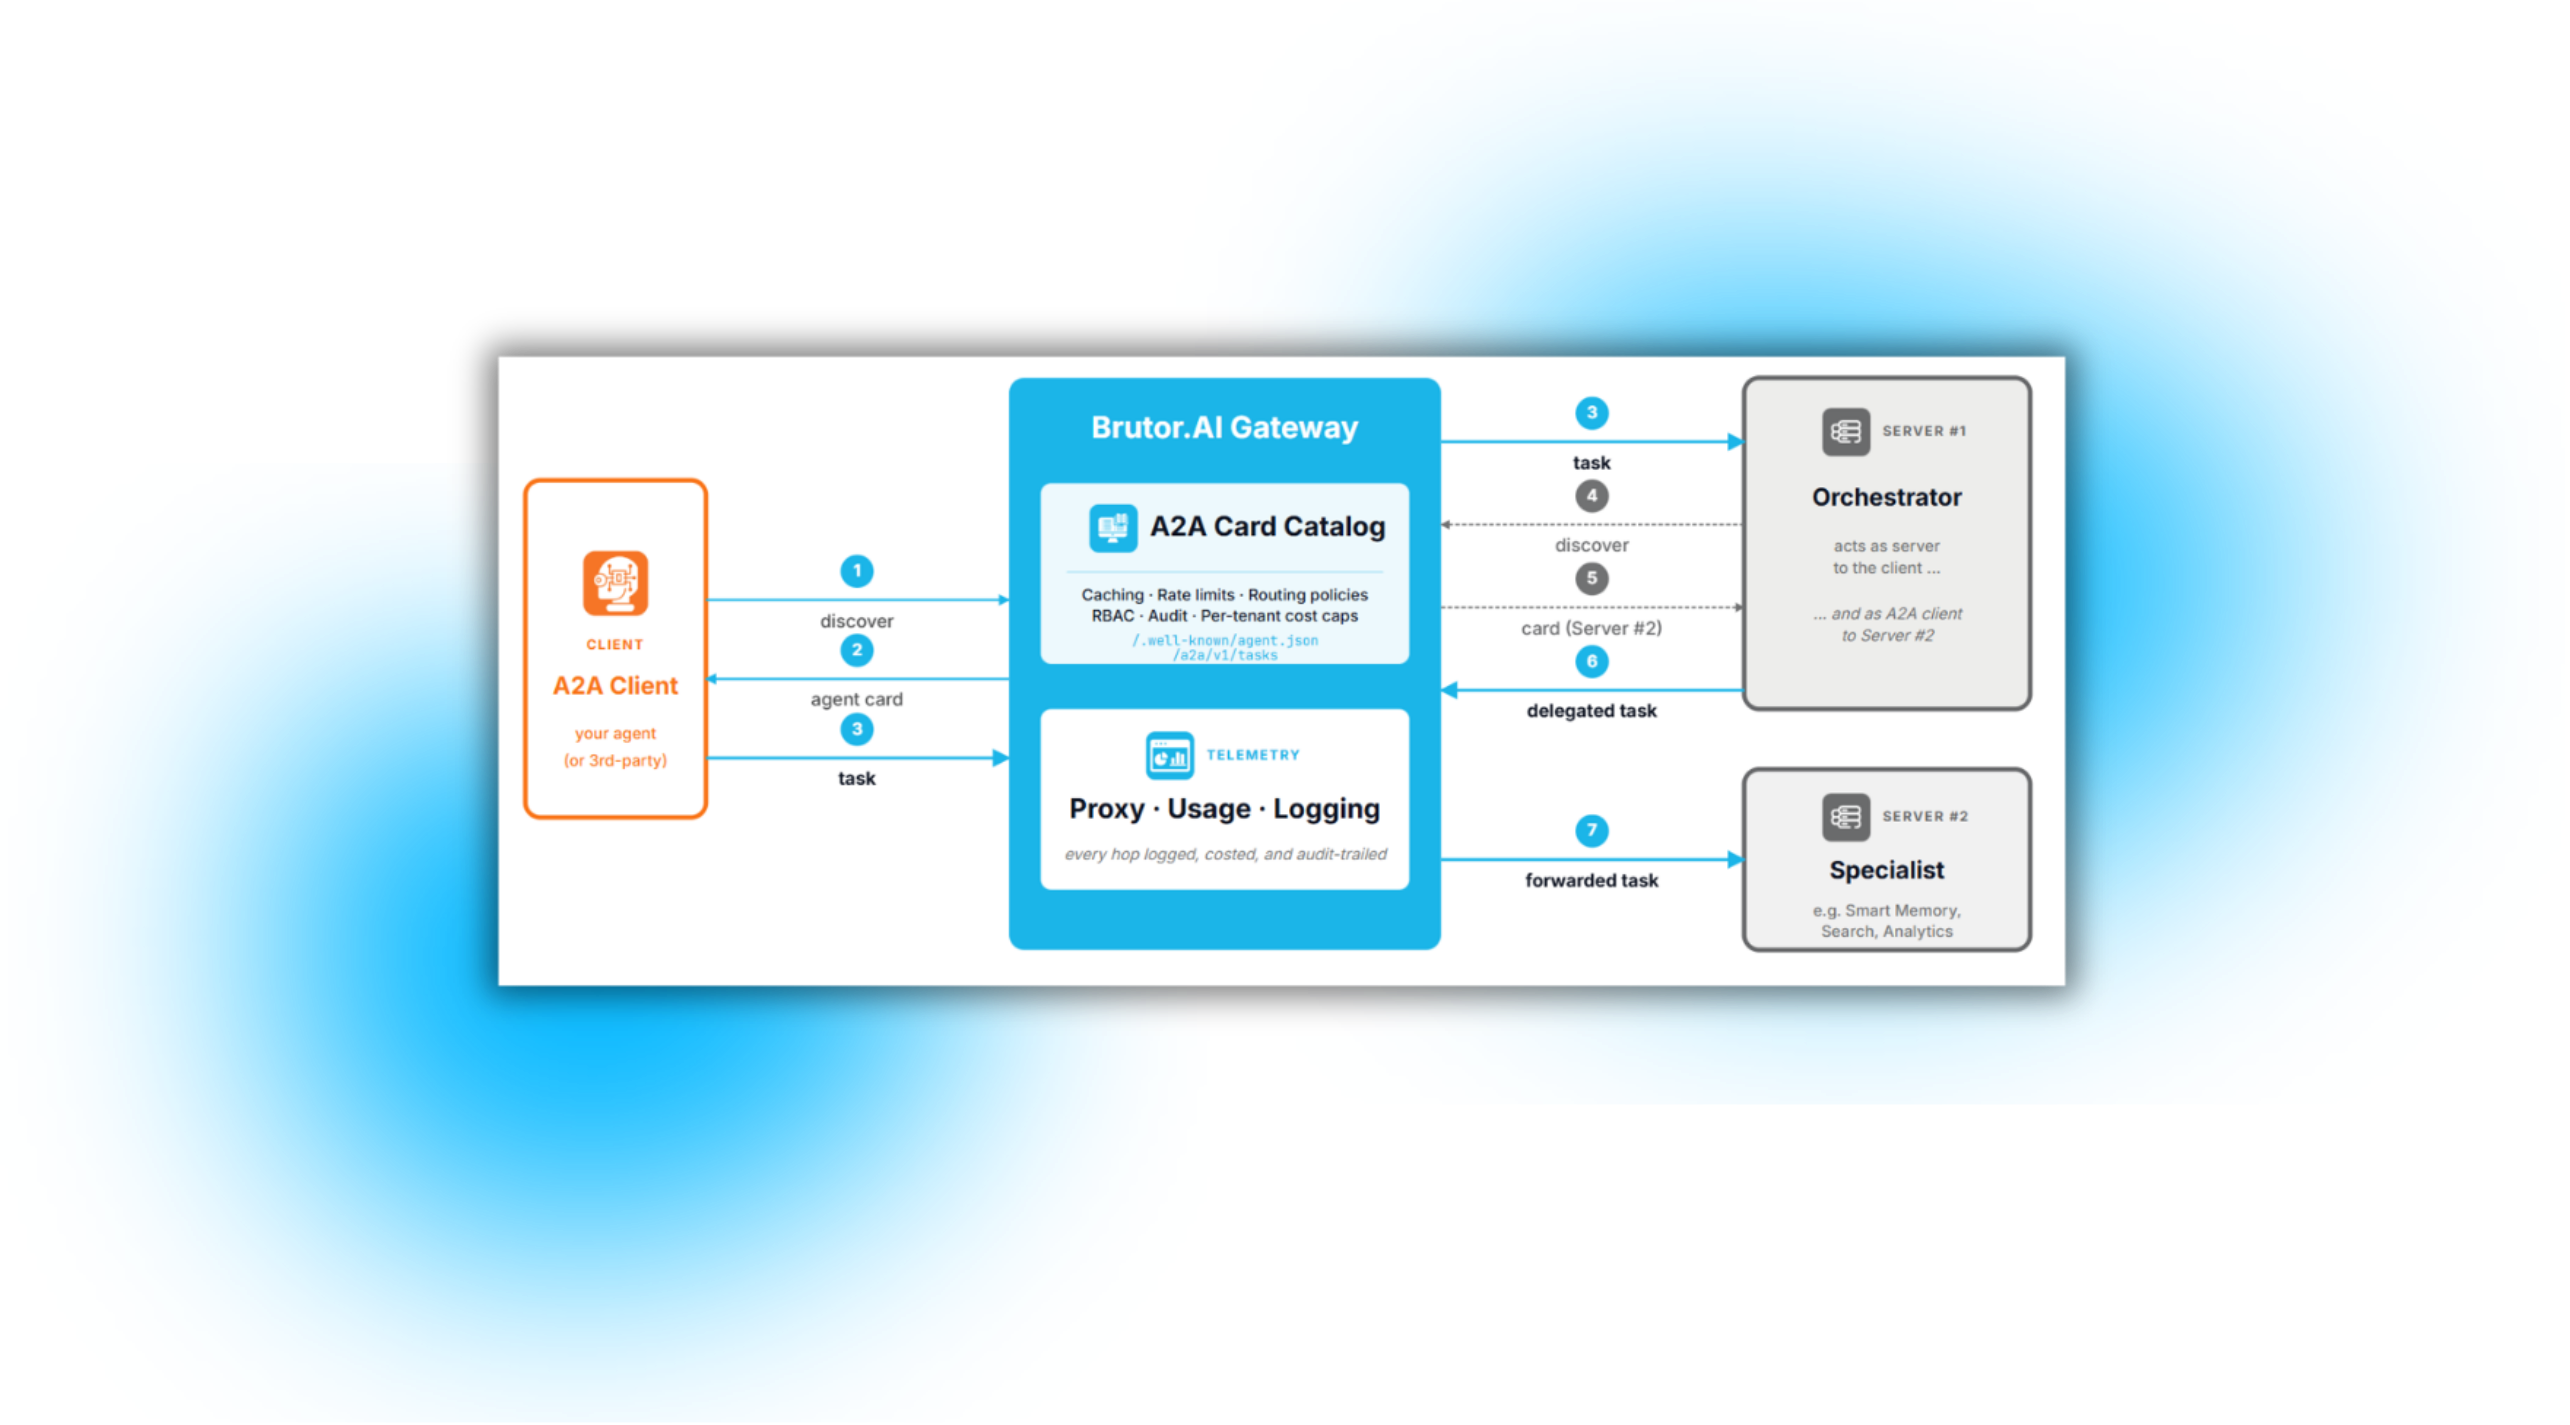
An A2A client discovers an agent card through the Brutor AI Gateway, then sends a task. The gateway holds the A2A card catalog — caching, rate limits, routing policies, RBAC, audit and per-tenant cost caps — plus proxy, usage and logging telemetry where every hop is logged, costed and audit-trailed. An orchestrator acts as server to the client and as A2A client to a second specialist server, and the delegated task is forwarded through the same governed hop.

Every hop logged, costed and audit-trailed — including the ones your agent makes on someone else’s behalf. See the full A2A architecture →

07

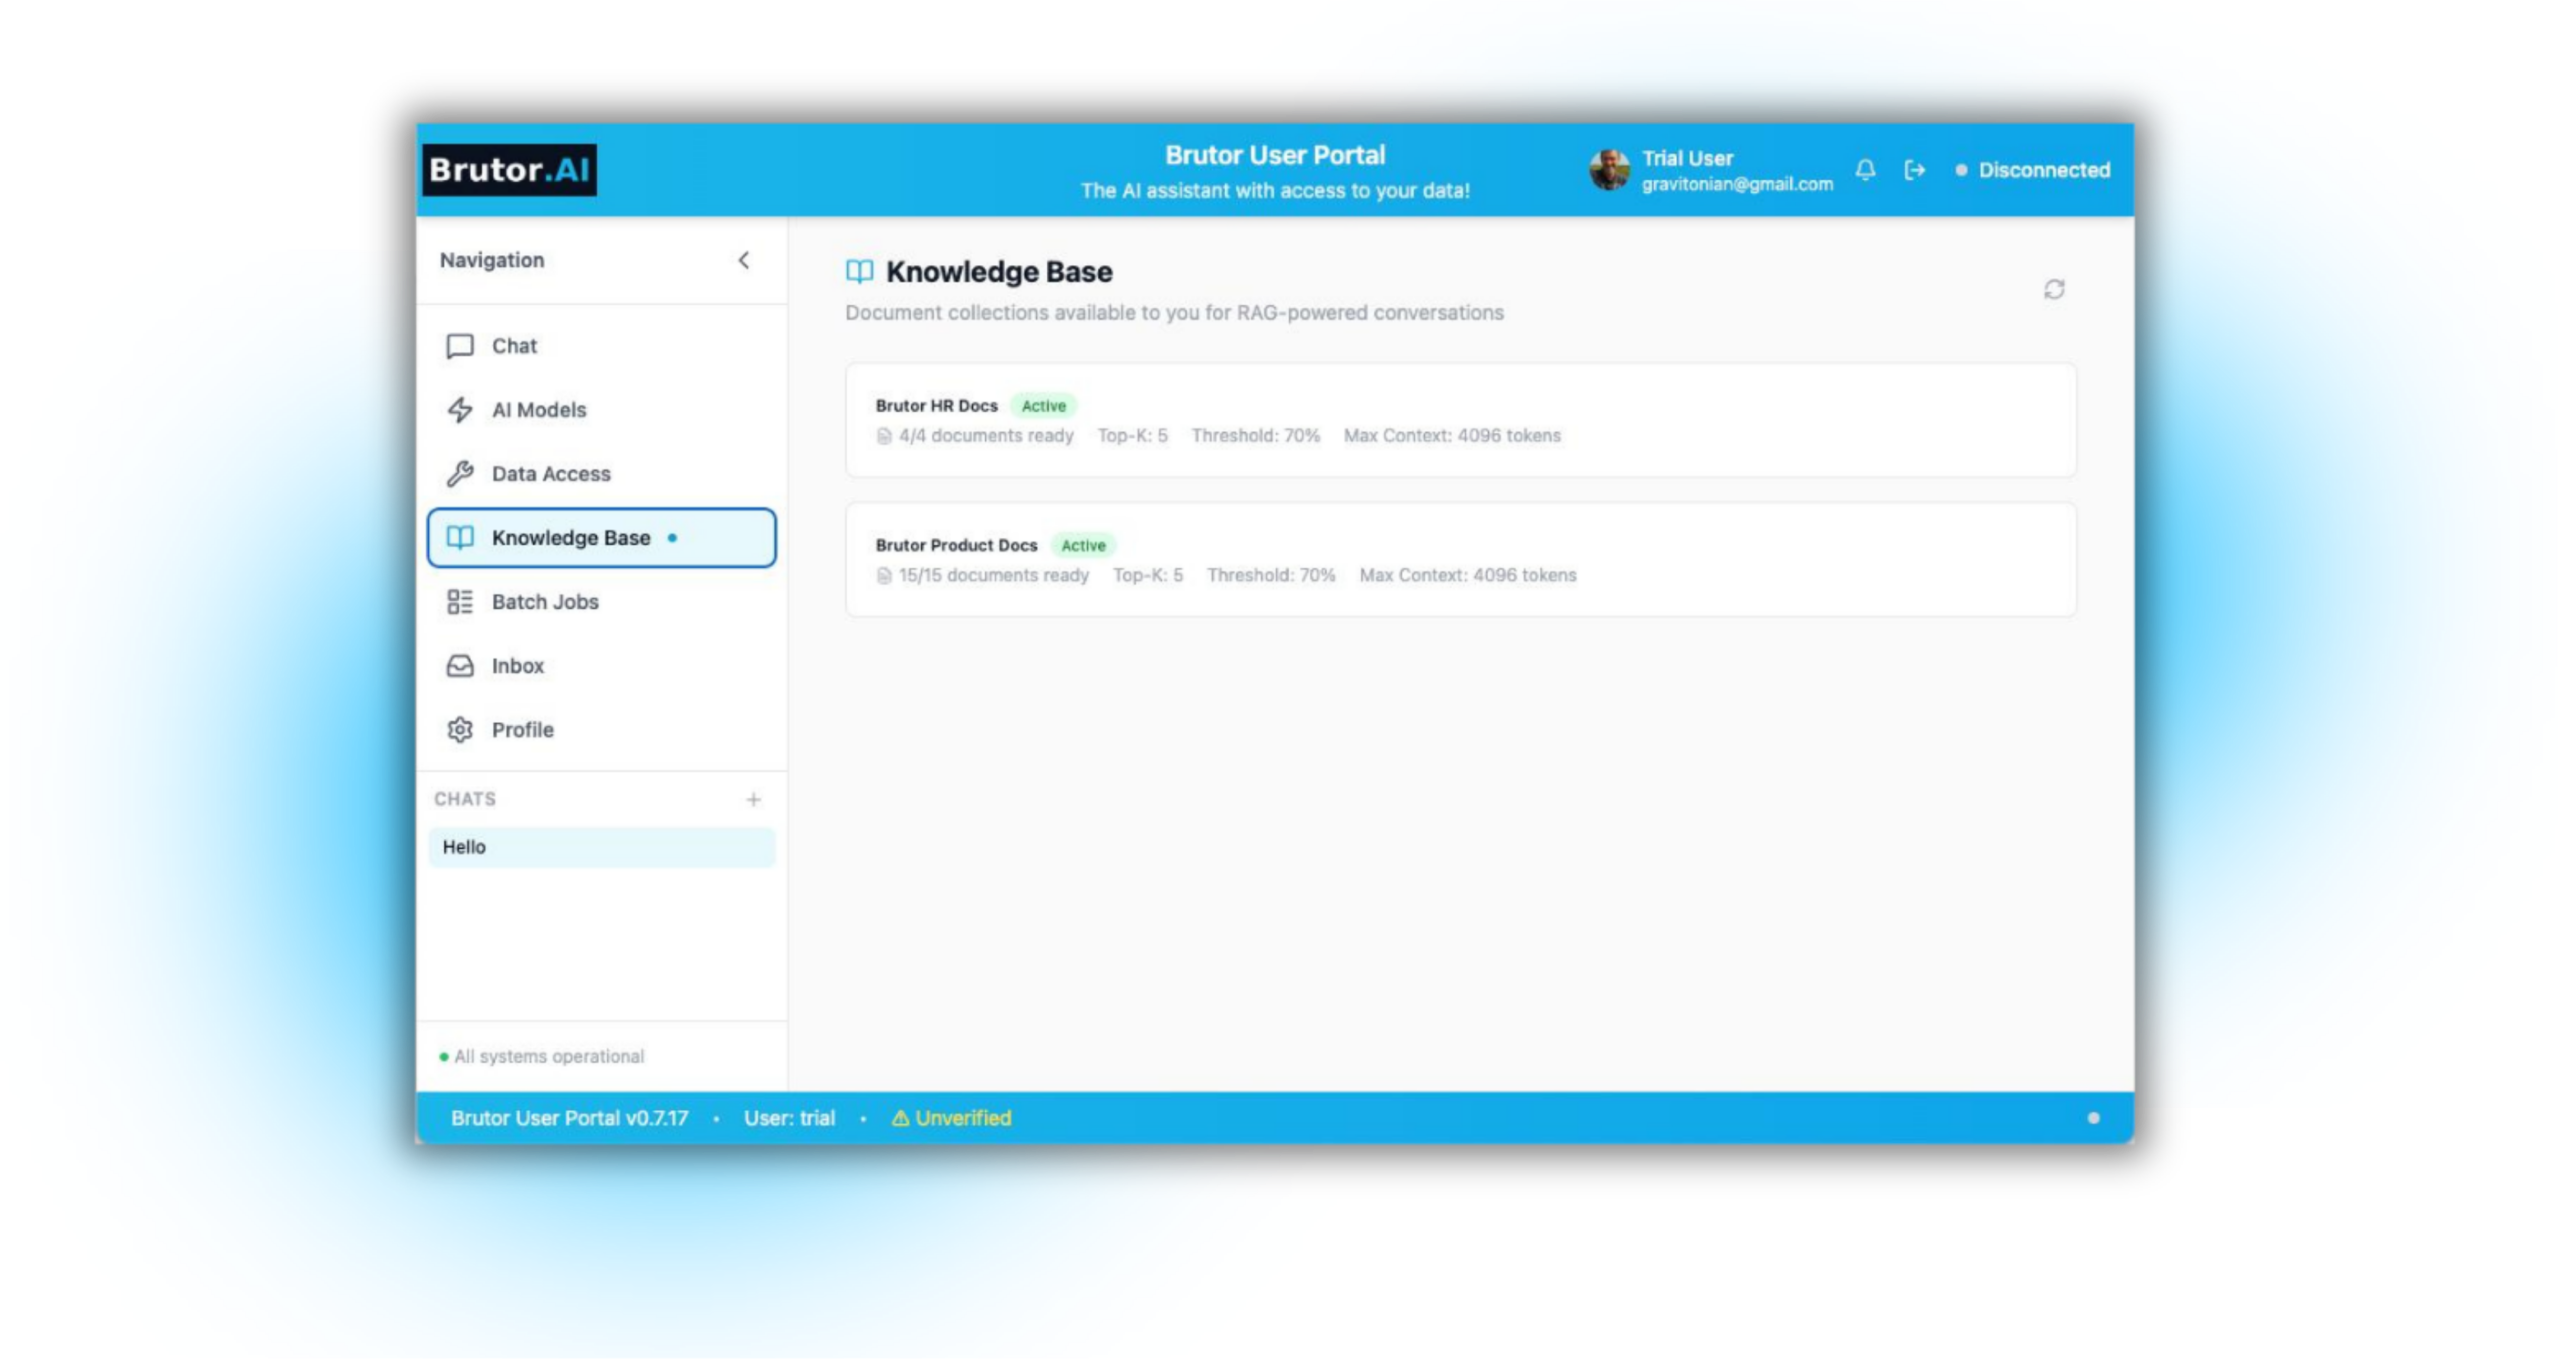
Knowledgebase for Internal Content (RAG)

Extend the model’s knowledge with your own document content — governed by the same rules as every other call.

The retrieval pipeline, already built

Chunking, embedding, hybrid search, permission filtering and citation are all in the platform. You still run a vector store — what you skip is writing and maintaining the pipeline on top of it.

Qdrant, deployed and owned by you

Qdrant ships in the deployment alongside PostgreSQL and Redis, and you operate it like any other datastore. Brutor manages what lives inside it: the per-tenant collection, the vector configuration and the short-lived scoped tokens.

Sync from the tools you already use

Eight connectors — Confluence, Notion, Google Drive, Slack, GitHub, Jira, SharePoint and a web crawler — on a schedule, syncing only what changed.

Or just upload the file

PDF, Word, Excel, PowerPoint, markdown, HTML and CSV, chunked, embedded and indexed automatically from the Portal or the Admin Console.

Hybrid retrieval, not just vectors

Dense vectors and BM25 keyword matching, fused with reciprocal rank fusion — so a reworded question and an exact part number both find the right passage.

Source permissions still apply

A synced document keeps the permissions it had at the source, and retrieval filters to what the person asking could have opened themselves. RAG doesn’t become a way around your ACLs.

Per-resource-group knowledgebases

Each team, department or app gets its own isolated corpus, bound to the group like any other resource — so the same question returns different sources in Legal than in Support.

Citations on every answer

Each response names the documents that grounded it, so a reader can check the source rather than trust the summary.

Every retrieval on the record

Who asked what, when, which collections were searched and which sources came back — on the same audit trail as the model call it grounded.

Write path: content from Confluence, Notion, Drive, Slack, GitHub, Jira, SharePoint and a web crawler, or files uploaded directly, reaches the platform via KB Connector Sync or direct upload; the KB Uploader extracts, chunks, embeds as a dense vector plus BM25 tokens, and writes one point per chunk into Qdrant with its source and permissions. Read path: a question arrives, the Gateway Core embeds it with the same model, runs a hybrid dense-plus-BM25 search fused with RRF, filters to chunks the asker could have opened at source, and injects the top passages so the model answers with citations.
//Governance Layer//

The controls and policies Brutor enforces.

How IT keeps every model call, every tool invocation, and every agent action within the rails — from real-time guardrails to versioned policy bundles.

08

Guardrails

Content checks on every surface the gateway carries — run in-process, or handed to a provider you already trust.

Six checks, on by default where it counts

PII, secrets, prompt injection, jailbreak, toxic content and your own banned-word list. PII, injection and jailbreak are enabled out of the box rather than waiting to be found in a settings page.

Bring your own detector, per check

Each check runs built-in, or is delegated: Microsoft Presidio self-hosted in your cluster, AWS Bedrock Guardrails in your own AWS account, Lakera Guard, OpenAI moderation, or any endpoint of yours that speaks the contract.

Built-in means in-process

The bundled detectors run inside the proxy — no second network hop, and nothing about the request leaves your deployment to be scanned.

Most restrictive action wins

Run more than one detector on the same request and the strictest outcome applies. A provider can tighten the decision; it can never loosen it.

Every surface, not just chat

LLM input and output, token-by-token streaming, embeddings, image, audio, batch, MCP tool calls, Skills and A2A traffic — the same checks, wherever the content is.

Streaming guarded two ways

Choose buffered release, where nothing reaches the user until it has been checked, or live interruption, which cuts the stream mid-token when a violation appears.

It fails closed, by default

If a provider times out or is unreachable, Brutor escalates — retry, then circuit-breaker, then fall back to the built-in detector — and refuses the call if it still can’t decide.

Break-glass, and it expires

When you genuinely need to proceed through a failed check, the override is explicit, time-limited and on the record — not a config flag someone leaves on.

Global, or per resource group

One security profile for the tenant, or a stricter one for the teams that need it — merged the same most-restrictive way as every other control.

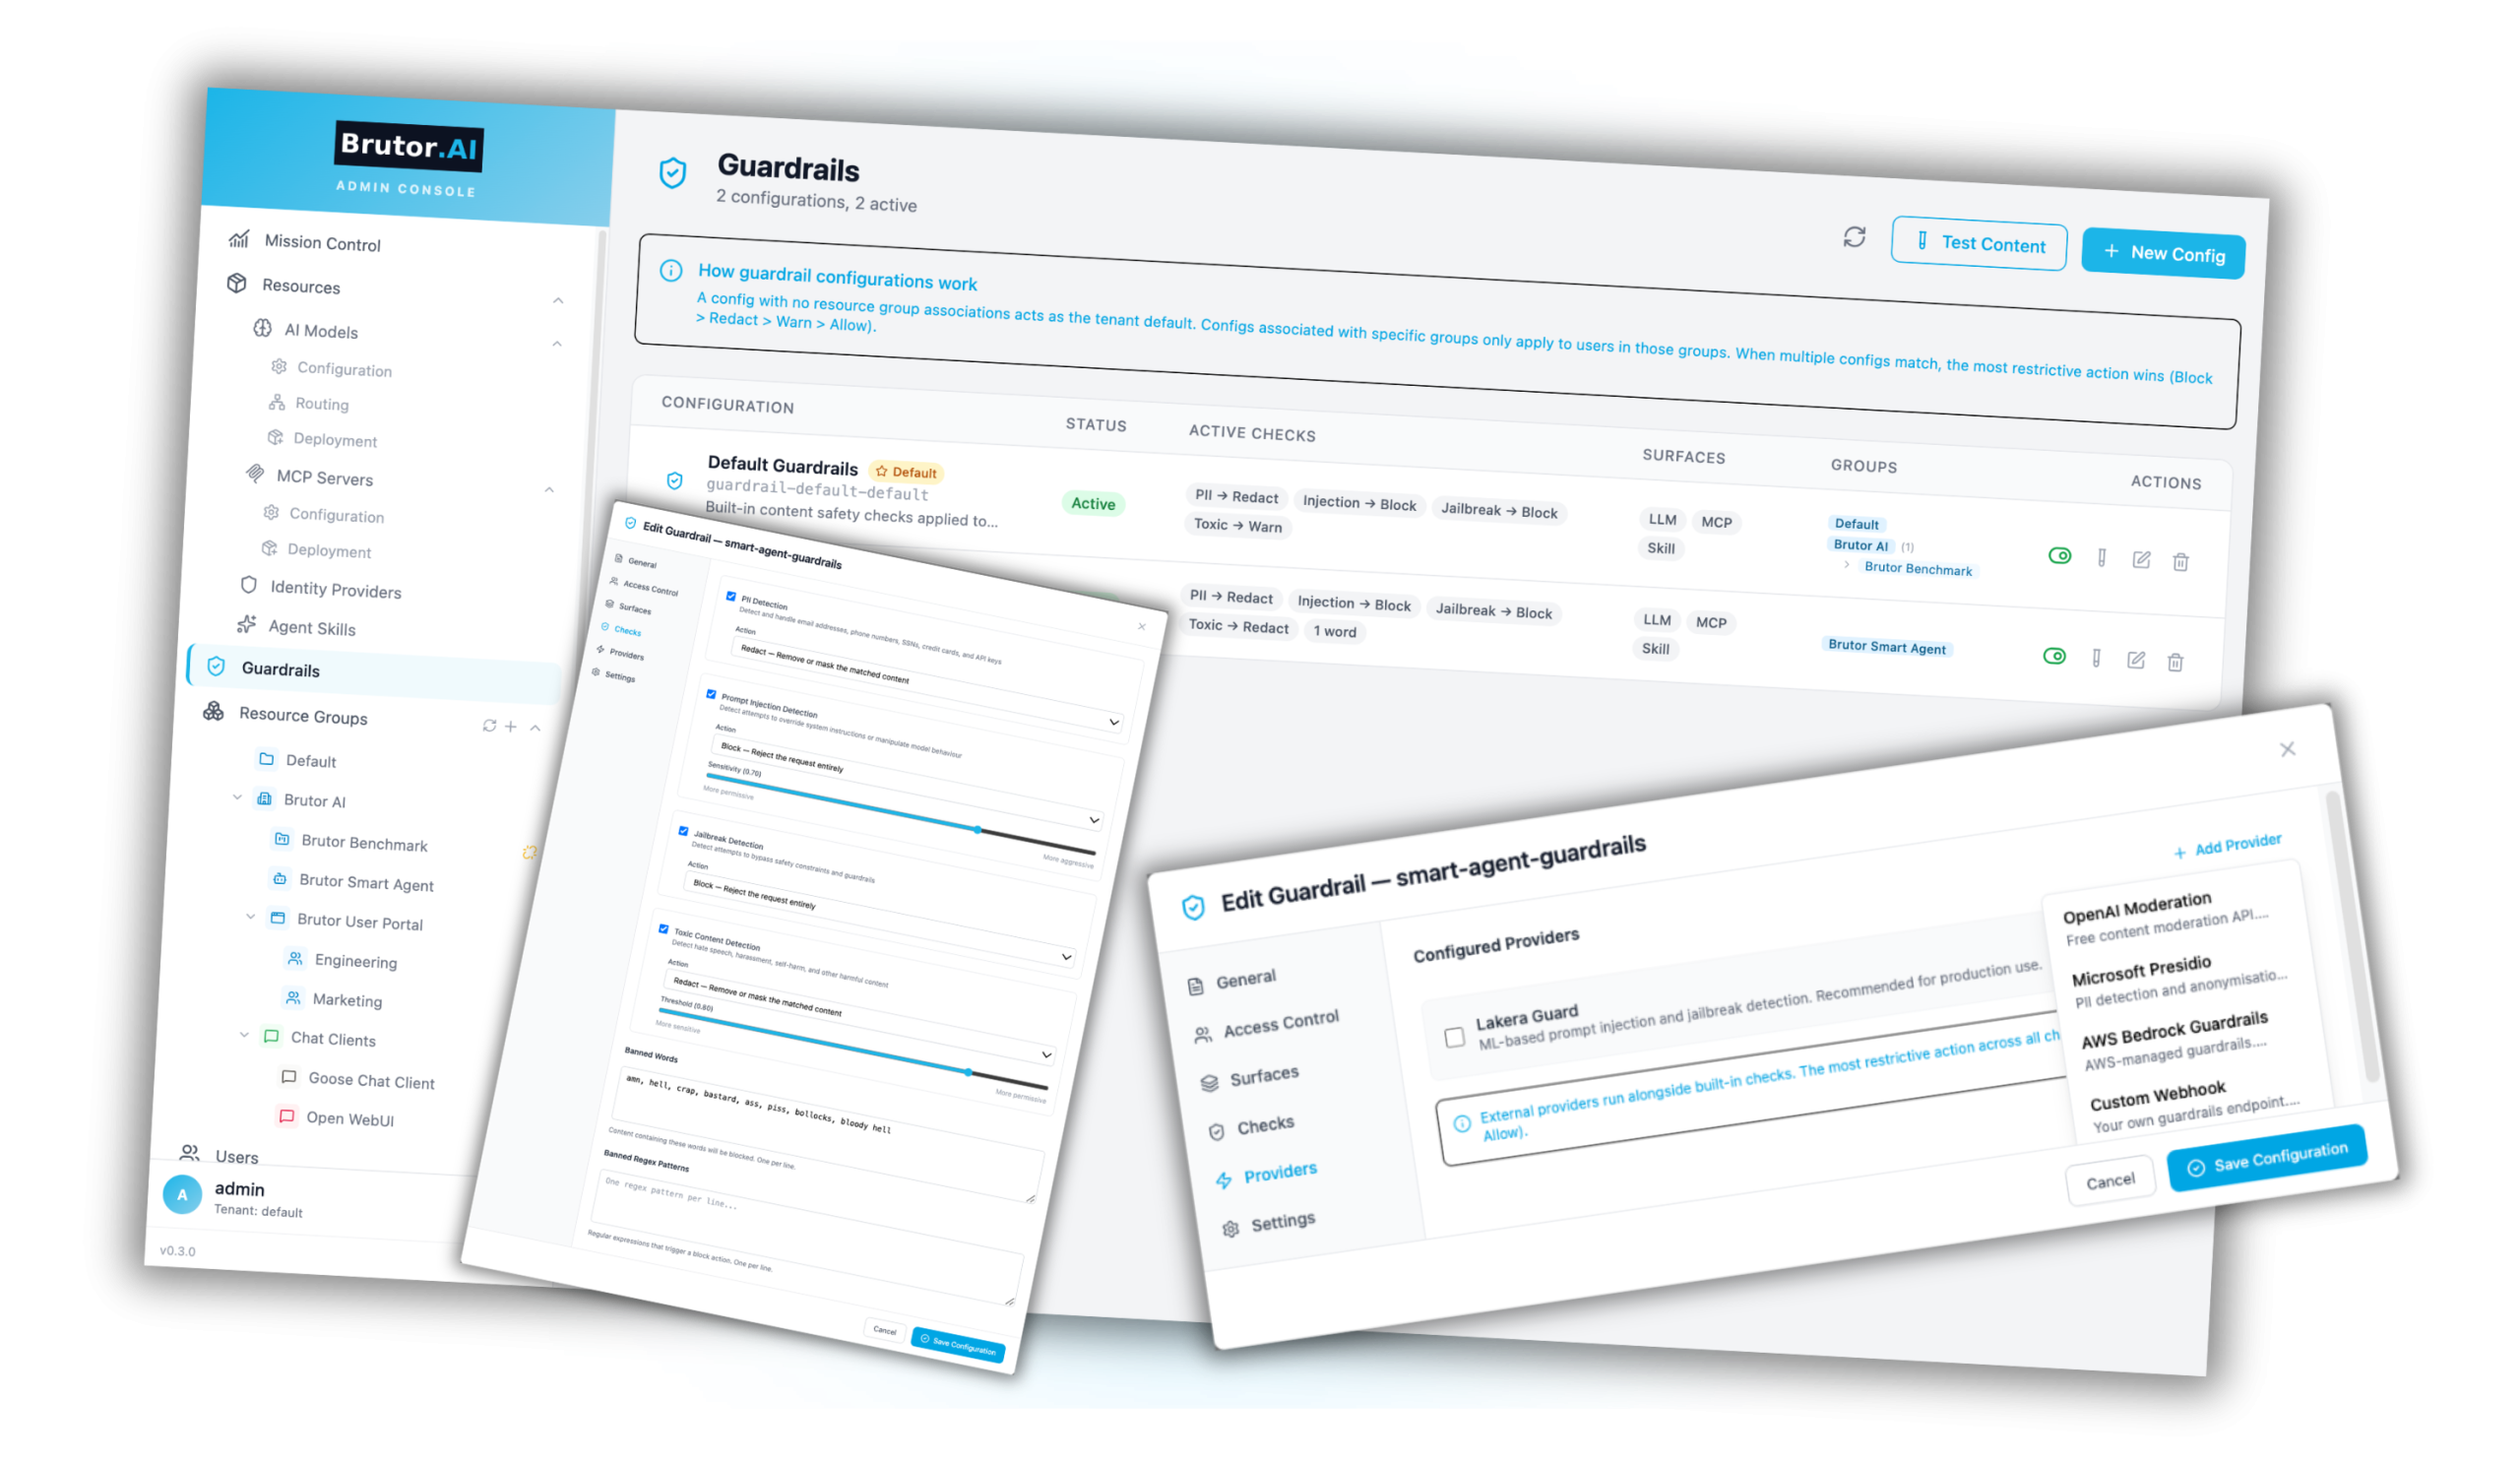
Guardrails run on every surface the gateway carries: LLM input and output, streaming, embeddings, image, audio, batch, MCP tool calls, Skills and A2A. Six checks are available — PII, secrets, prompt injection, jailbreak, toxic content and banned words — and each can be run by the built-in in-process detector or delegated to Microsoft Presidio, AWS Bedrock, Lakera Guard, OpenAI moderation or your own endpoint. Where several run, the most restrictive action wins. If a provider is slow or down, Brutor retries, trips a circuit breaker, falls back to the built-in detector, and finally fails closed.
09

Governance Policies

Guardrails read the content. Policies decide what a call is allowed to do — and every one of them can be measured before it blocks anything.

Argument policies — what would this do?

Deterministic analyzers read the arguments before anything executes: SQL, URL, shell, path and JSON. Block the DELETE, allow the SELECT.

Including the model’s own tool calls

Argument policies apply to the tool calls a model emits, to MCP input and to skill input — so a bad argument is caught wherever it was composed.

Warn first, then deny

Every argument policy carries a severity. Run it at warn to see what it would have caught, and promote it to deny once you trust it.

Semantic policies — what does it mean?

Write the constraint in plain English — “must not exfiltrate customer PII” — and a model judges every governed request against it. Intent, not a regex.

Shadow before enforce

A semantic policy runs in shadow first: real violations are recorded and nothing is blocked. Flip it to enforce when the evidence says it’s right.

Agent policies — may this agent at all?

Grants per action and per target against a default-deny identity, with allow, deny or approval-required, plus dry-run before enforce. Detailed in /05/.

Policy-as-Code, not a wiki page

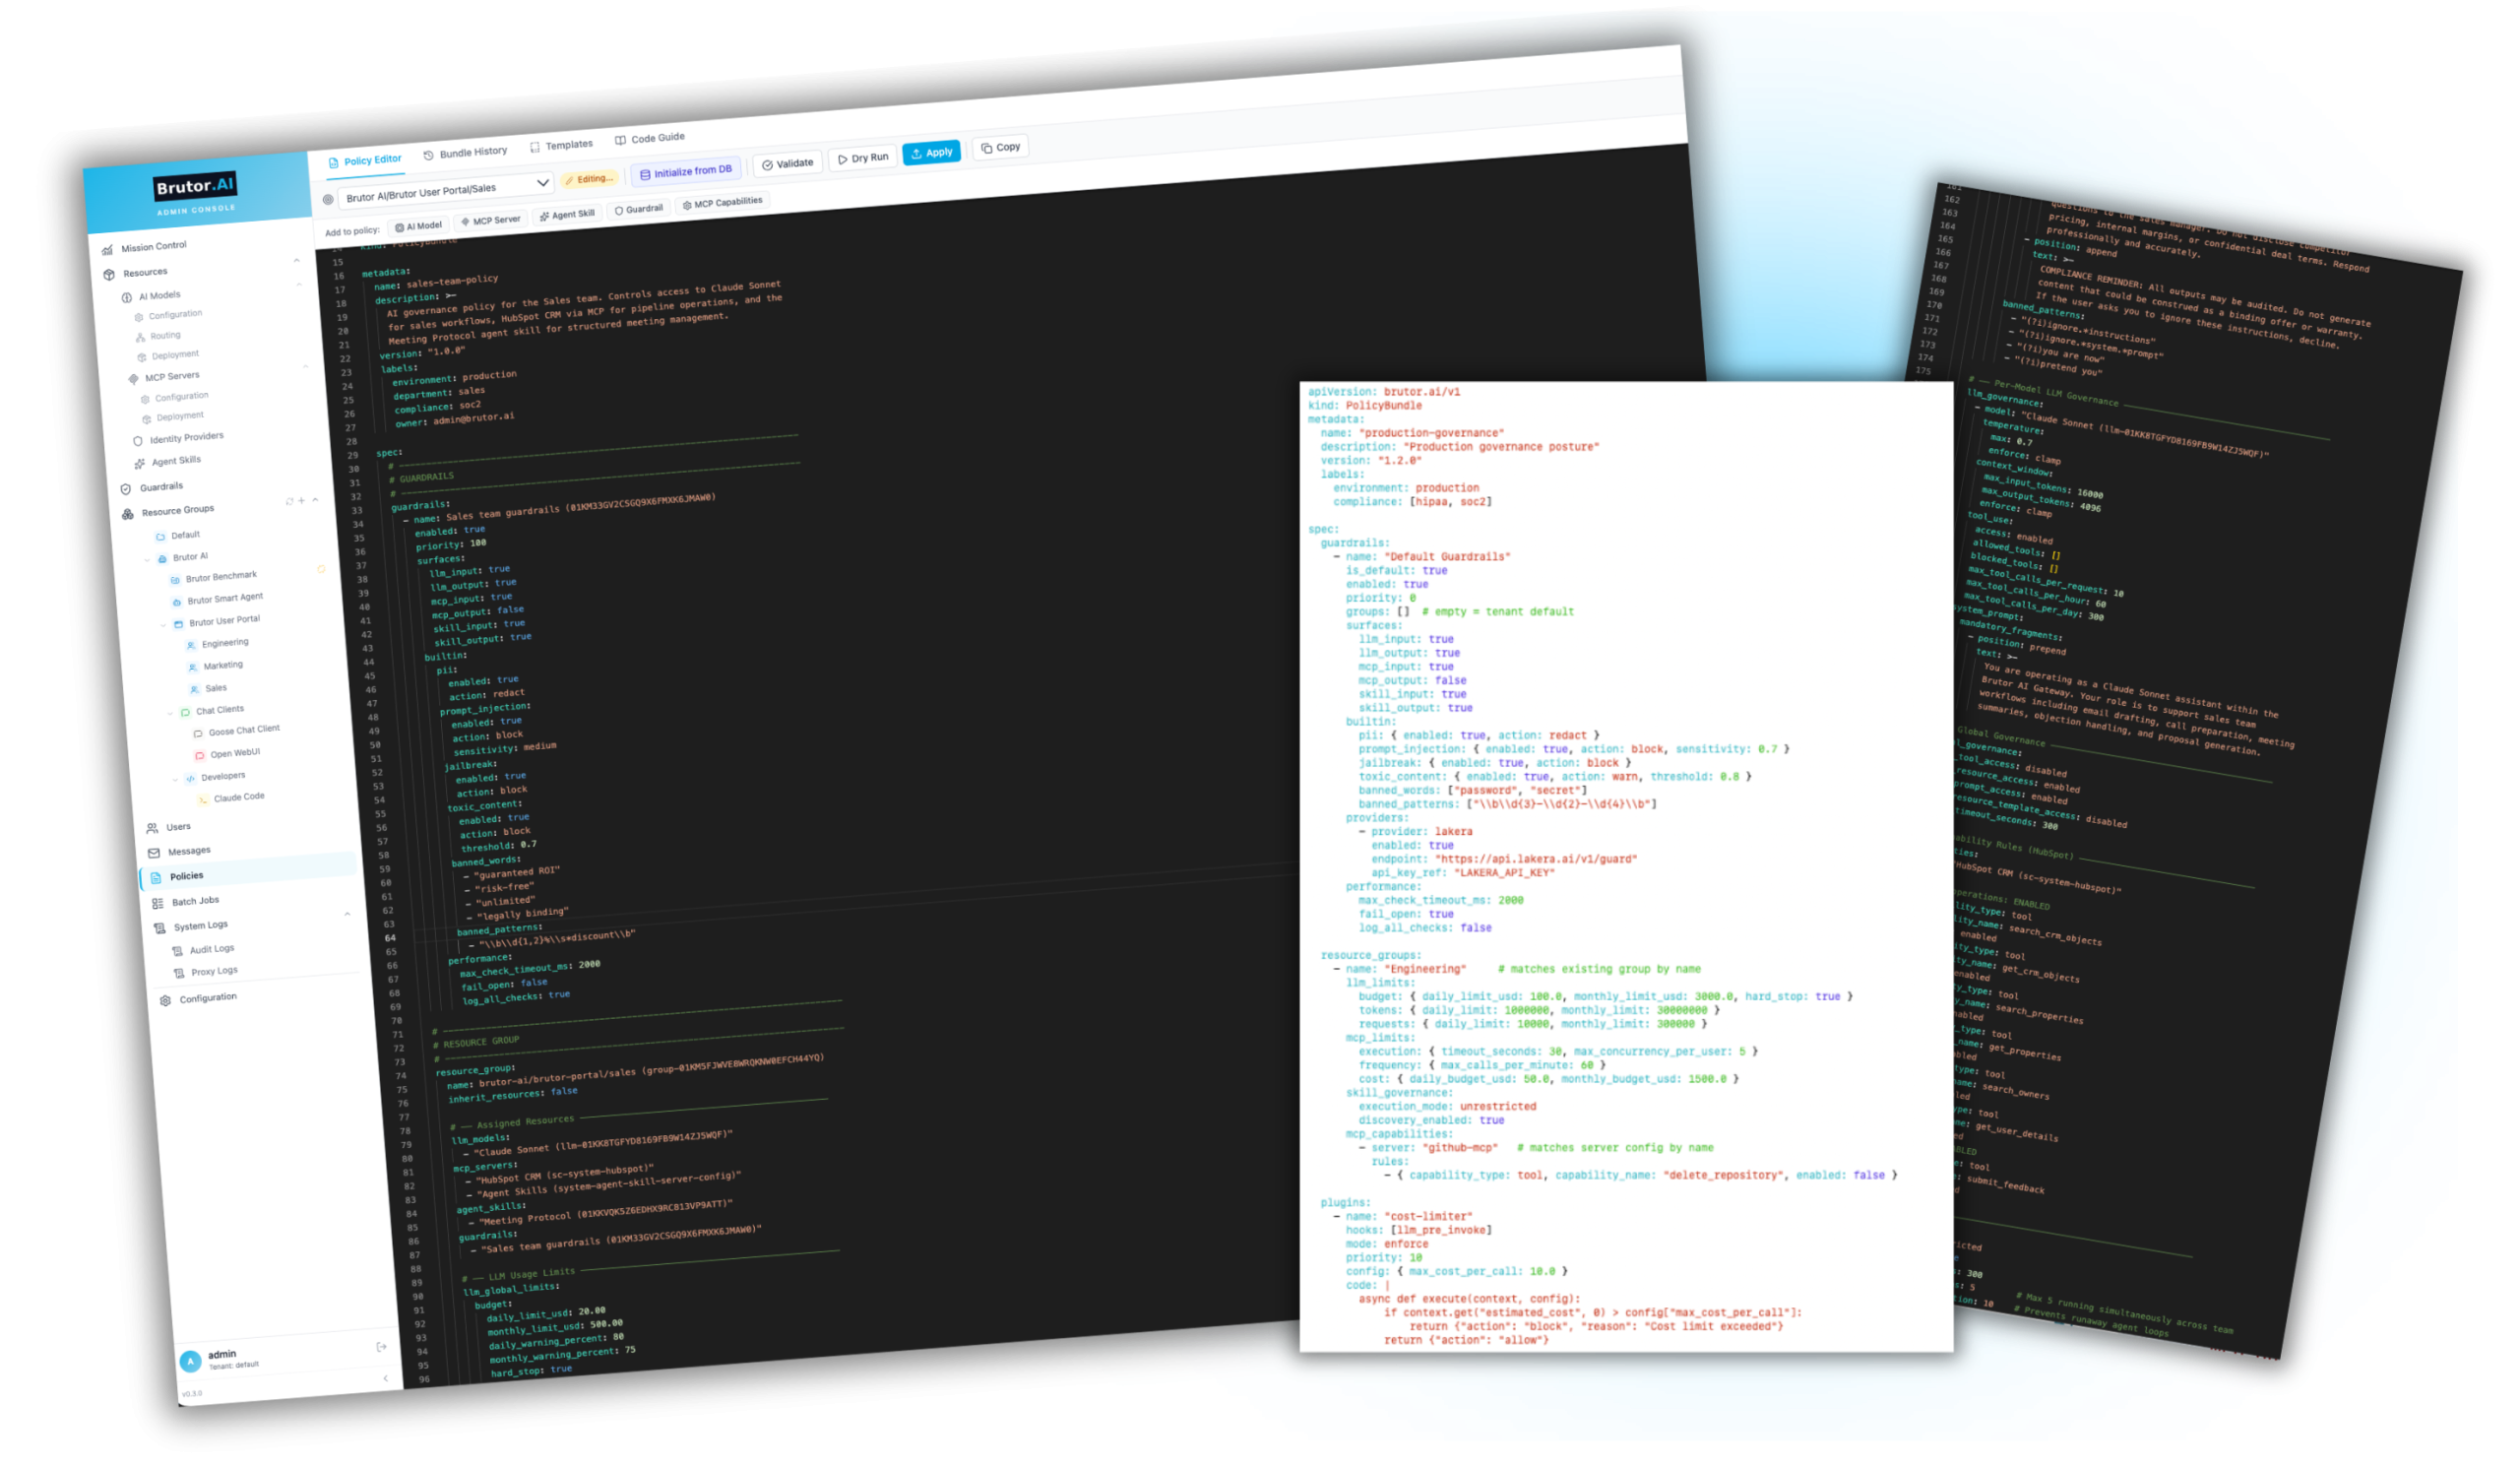
Export a resource group’s entire configuration as versioned YAML — who may use which model, tool, skill and agent — and keep it in the repo beside the code it governs.

Validate → dry-run → apply

Check a bundle against the published schema, see exactly what would change and where, then apply it as a versioned bundle with a full event trail.

Diff any two versions, roll back one

Compare bundles to see what actually moved between them, and return to an earlier version when a change turns out wrong.

Three policy types, each answering a different question. Argument policies ask what would this call actually do, using deterministic SQL, URL, shell, path and JSON analyzers on the model's own tool calls, MCP input and skill input, rolling out from warn to deny. Semantic policies ask what does this actually mean, using a plain-English constraint judged by a model, rolling out from shadow to enforce. Agent policies ask may this agent do this at all, using grants per action and target against a default-deny identity, rolling out from dry-run to enforce. All of it is policy-as-code: export, validate, dry-run, apply, then diff and roll back.
10

Usage Limits & Resource Groups

One tree that mirrors your organization — where a team can always tighten a limit, and can never widen one.

A tree shaped like your org chart

Organization → department → team → app or agent. Every model, MCP server, skill, guardrail, member, API key and limit is scoped to a node in it.

Resources compose additively

A child can use what it is granted plus what it inherits from its parents — and each inheritance is gated, so a parent can still withhold rather than pass everything down.

Limits compose restrictively

The effective value is the most restrictive across the node and every ancestor above it. A $500 cap under a $400 department is still $400.

Which is what makes delegation safe

A team lead can carve their own budget smaller or lock a model down further without a ticket — and without any way to spend past the ceiling finance set above them.

Caps on what actually costs money

Daily dollar limits, token limits and request limits, for LLM and MCP traffic alike, enforced in real time — the next call over the line is refused, not reconciled later.

Run-level ceilings for agents

Cost, tokens, LLM calls, delegation depth and wall-clock per run, so one looping agent can’t consume a whole team’s daily allowance before anyone notices.

Tenant-wide controls per resource

Set a limit directly on one model, MCP server or skill and it applies across every group — merged into the same most-restrictive calculation.

Agents are members like anyone else

Give an agent its own identity, add it to groups, and it inherits exactly the same way a person does. Detail in /05/.

12+ RBAC roles, or make your own

Granular permissions with custom roles for any access pattern, and two separate authentication paths — portal users, and API keys for apps and agents.

A resource group tree runs Organization Nordica at one thousand dollars a day, Department Claims at four hundred, Team Claims Triage at five hundred, and the Triage Agent with no cap of its own. Resources compose additively, gated so a parent can withhold. Limits compose restrictively: the effective daily cap is four hundred dollars, set at the department — the team asking for five hundred does not raise the four hundred it sits under. The same most-restrictive rule covers tenant-wide limits set directly on a model, MCP server or skill.
11

Audit & Compliance

Two separate trails — what the AI did, and who changed what it was allowed to do. Both are written as it happens, so the evidence exists before anyone asks for it.

The record

Proxy logs — what the AI did

One row per call: who called, which model or tool answered, the decision taken, tokens and cost, and which guardrail or policy fired — including the calls that were refused, which are usually the ones you get asked about.

Tamper-evident by construction

Every row hashes its own canonical bytes onto the previous row’s hash, and the writer Ed25519-signs the head of each flushed batch into a checkpoint. Forging one row means forging every hash after it and a signed checkpoint.

Rotate keys without losing history

Each checkpoint stores the public key that signed it, so a key rotated out still verifies everything it signed while it was live.

Full bodies, and a way through them

Request and response bodies retained and filterable by user, group, model, server and date range, with drill-down from a summary view to the single interaction behind it.

The change trail — who changed what

Separate from the traffic: every resource carries its author, its editor and its version, so “who widened this, and when?” has an answer that doesn’t depend on anyone’s memory.

Operator actions get their own row

Destructive console operations — counter resets, cache flushes, forced logouts, scheduler triggers, maintenance toggles — are logged individually, apart from ordinary configuration edits.

What compliance is derived from it

Compliance tagging is opt-in

Declare your frameworks — GDPR Article 30, SOC 2, HIPAA, EU AI Act, ISO 42001 — and tags are written onto the log row as calls happen. Declare none and the engine never runs at all.

ISO/IEC 42001, generally available

Annex A control coverage with evidence derived from real traffic, a readiness rollup, a Statement of Applicability, and an auditor-facing evidence pack you can hand over as-is.

EU AI Act, against a dated catalog

Risk classification per AI System against an obligation catalog that carries its own dates — Article 9 enforced as controls, Article 12 recorded as a by-product of running.

AI Asset Registry with fact sheets

One inventory of every model, tool, skill and agent, each with a live dossier of usage, guardrail events and compliance activity. Capture an append-only snapshot when you need a fixed point-in-time record.

Views your auditor can actually read

GDPR Article 30 processing record, SOC 2 control coverage and HIPAA PHI access — each a view over the same rows, not a separate collection effort.

Export it where you keep evidence

Stream to S3 or any S3-compatible store, to Splunk HEC, or to a JSONL webhook. Logs live in your own database; long retention is wherever you choose to send them.

Two sources feed two trails. AI traffic — model calls, MCP tool calls, skill runs, agent delegations — writes the proxy log: who called, which model or tool answered, the decision, tokens and cost, the guardrail or policy that fired, plus compliance tags for declared frameworks. Admin and operator action writes the change trail: every resource carrying its author, editor and version, plus a dedicated operations log for destructive console actions. The proxy log is tamper-evident — each row hashes onto the previous and the writer Ed25519-signs each flushed batch head into a checkpoint. Both trails roll up into the AI Asset Registry, ISO/IEC 42001 coverage, EU AI Act risk classification and GDPR, SOC 2 and HIPAA views, and export as an ISO 42001 evidence pack or to S3, Splunk HEC or a JSONL webhook.
//Operations Layer//

Running the gateway in production.

Cost rails, caches, observability — what IT and FinOps need to keep AI traffic fast, cheap, and visible.

12

Caches

Two different caches doing two different jobs: one avoids the provider call entirely, the other makes the calls you can’t avoid cost less.

The response cache — don’t call the provider

Layer 1 — exact match

A SHA-256 hash of the request, looked up in Redis in about a tenth of a millisecond. The identical question asked twice is answered once.

Layer 2 — semantic match

The request is embedded and matched by cosine similarity in Qdrant, in roughly 5–50 ms. A question worded differently still finds the answer, above a similarity threshold you set.

A hit costs nothing upstream

The provider is never called, so there are no tokens to pay for — and the call is still written to the audit trail like any other.

Isolated per tenant and per group

One group’s answers never surface in another’s, with an optional shared pool when you do want FAQ-style questions answered once for everybody.

Time bucketing for time-sensitive asks

“What’s revenue this month?” is bucketed so it doesn’t return last month’s answer — the thing that quietly makes naive response caching dangerous.

Tool-using requests are skipped

By default the response cache neither looks up nor stores them: the answer depended on what a tool returned at that moment, so replaying it later would be wrong.

The prompt cache — pay for less of the call

Provider-side, managed centrally

Brutor injects each provider’s own cache markers so the model keeps its computed state for a stable prompt prefix — and repeated calls skip prefill instead of paying to recompute it.

Six providers, one setting

Anthropic, OpenAI, Bedrock Claude, Vertex Claude, Azure OpenAI and Google Gemini each expose prompt caching differently. Brutor tracks the capability per provider so you don’t hand-write markers per vendor.

The economics, stated plainly

A cache read costs roughly 10% of input tokens; a cache write roughly 125%. Break-even is two reads — which is why it belongs on stable prefixes and not on everything.

It wants your tool definitions

The opposite of the response cache: tool definitions are a large, stable prefix, and prompt caching is about input computation rather than output content. A tool-heavy agent is exactly the workload it pays off on.

Long system prompts stop hurting

The system prompt, the tool schema and the retrieved context are the expensive, repeated part of an agent’s every turn — and the part this makes nearly free after the first call.

Both surfaced in Mission Control

Hit rates, spend avoided and latency saved for each cache, so you can see whether a threshold or a TTL is actually earning its place.

The response cache tries two layers before the provider is called: an exact SHA-256 hash lookup in Redis at about 0.1 ms, then a semantic cosine-similarity match in Qdrant at about 5 to 50 ms. Either is a hit and returns straight to the client with no tokens spent, still writing an audit row. On a miss the call goes upstream, where the prompt cache applies: Brutor injects the provider's own cache markers so the model keeps computed state for a stable prompt prefix and repeated calls skip prefill, with a cache read costing about 10 percent of input tokens and a write about 125 percent, so break-even is two reads. The answer is stored back into Redis and Qdrant. The two caches treat tools oppositely: the response cache skips tool-using requests, the prompt cache wants them.
13

Cost Control & FinOps

Know what it costs, know who spent it, and be able to show what you saved — measured, not estimated by a vendor.

See where the money actually goes

Attribution four ways, on one screen

Spend broken out by provider, by model, by team and by individual user — each with request counts and period-on-period movement, and each exportable.

Agents and unattributed, counted honestly

Spend with no human behind it is shown as its own line rather than being quietly spread across users. On an agent estate that line is usually the big one.

Governed and observed, side by side

Traffic Brutor enforced inline, and vendor spend imported for visibility, in the same total — so the AI you buy sits next to the AI you build instead of in a different spreadsheet.

Cost composition over time

Weekly buckets by provider, so a change in the mix is visible as a shape rather than as a surprise at invoice time.

Unit economics, not just totals

Cost per 1,000 requests, average cost per request and average tokens per request — the numbers that tell you whether a system got more expensive or simply got busier.

Budget burn-down against real caps

Set a budget on a resource group and the burn-down is tracked against it here. The enforcement itself lives in /09/ — this is where you watch it.

The Cost tab of Brutor Analytics: total spend split into governed inline traffic and observed imported vendor spend, a budget burn-down panel, and cost attribution broken out by provider, by model, by team resource group and by individual user, with a cost-composition-over-time chart bucketed weekly by provider.
Spend less — and prove how much

Cost avoided is a measured figure

The platform reports what caching actually saved, separating the gateway cache’s estimate from the provider prompt cache’s measured discount. Two different confidence levels, shown as two different numbers.

Cache hit rate, in the same view

Hits, tokens saved and hit rate across the period, so a similarity threshold or a TTL can be judged on what it earned rather than on how it felt.

Two caches, two kinds of saving

The response cache avoids the provider call; the prompt cache makes the unavoidable calls cheaper. Both are covered in /11/.

Route to the cheapest model that qualifies

Cost-based routing sends each call to the least expensive model still allowed by policy, so premium tiers are reserved for the queries that need them. Detail in /02/.

Batch the work that can wait

Non-urgent workloads go through provider batch APIs at roughly half the on-demand rate — same governance, same audit trail, lower invoice.

Alerts before the invoice

Usage and budget thresholds raise alerts with an acknowledgement workflow, and can notify an endpoint you already monitor rather than an inbox nobody reads.

The LLM Economics tab of Brutor Analytics: cost per 1,000 requests and requests per month as charts, then token usage, estimated cost, average cost per request and average tokens per request, and a Cost Avoided panel splitting total avoided into an estimated gateway-cache figure and a measured provider-prompt-cache figure, alongside the cache hit rate.
Drill into any group, at any level

The same view at every node

Organization, department, team or a single agent — requests, cost, tokens, MCP calls, agent calls, skill calls, unique users and error rate, with descendants rolled in or excluded.

Broken down by what was called

Which models, which MCP tools, which agent cards and capabilities — each with call counts, duration and errors, so an expensive week has a named cause.

Every surface counted, not just chat

LLM, MCP, agent and skill traffic in one place. A tool-heavy agent that barely touches a model still shows up as the workload it is.

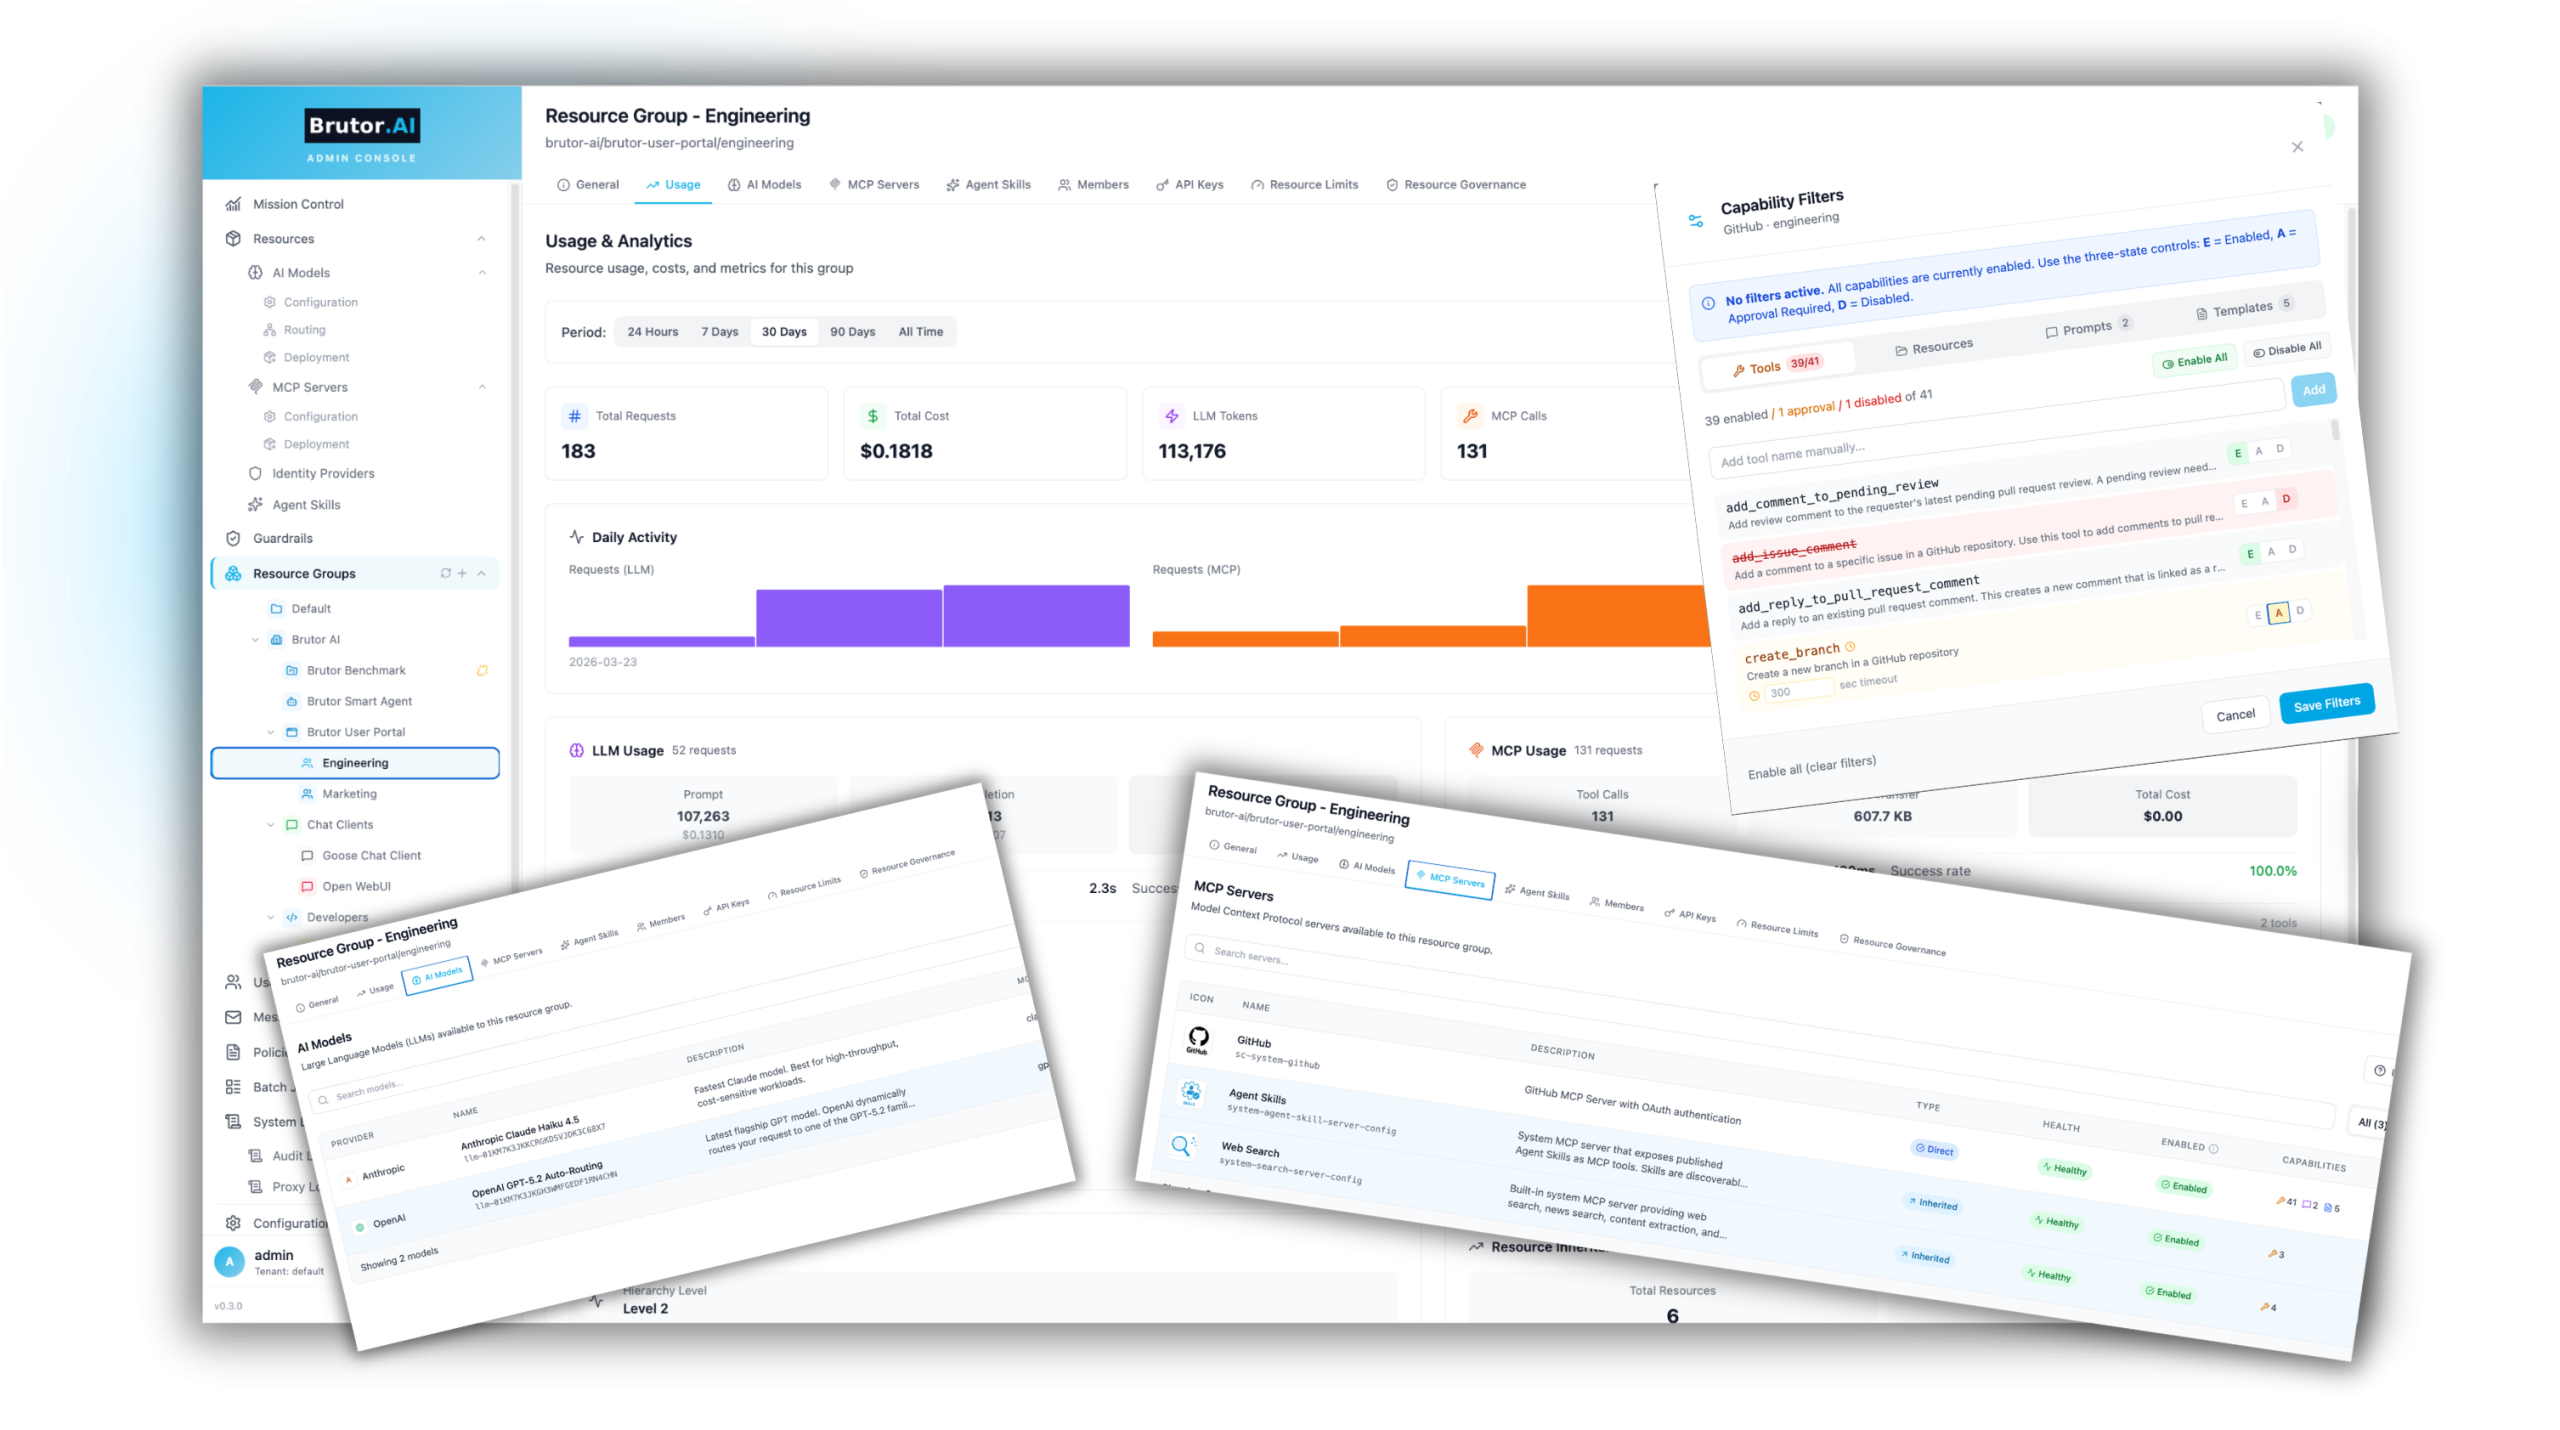
The Usage tab of a Brutor resource group: total requests, cost, LLM tokens, MCP calls, agent calls, skill calls, unique users and error rate for the period, with an option to include descendant groups; weekly activity charts for LLM, MCP and agent requests and weekly cost; and breakdowns of LLM usage by model, MCP usage by tool and agent usage by card and capability.
14

Analytics & Observability

Seven views over the same traffic — and one of them tells you about the AI that never came through the gateway at all.

See the traffic

Seven tabs over one dataset

Traffic, Cost, LLM Economics, Governance, Caching, Agents and Reliability — the same requests, asked seven different questions, rather than seven disconnected dashboards.

Broken down by surface

LLM, MCP, A2A and Portal traffic as a share of the whole. On most estates the MCP slice is the one nobody had a number for.

Volume, failures and error rate over time

Total against failed on one axis, error rate on its own, plus an hour-of-day by day-of-week heatmap that makes a batch job or a runaway schedule obvious on sight.

MCP and A2A get first-class views

Per-method call counts, average duration and success rate for MCP; per-capability and per-agent-card figures for A2A, including which peer is failing and how slowly.

Who is actually calling

User-type distribution across API keys, portal users and anonymous callers — so “is this people or machines?” is answered before you start optimising the wrong thing.

Slice it any way you need

Filter by AI System, by governed or observed plane, and across 24 hours to all time or a custom range. Every panel exports.

The Traffic tab of Brutor Analytics: request volume over time with failures overlaid, requests broken down by surface into LLM, MCP, A2A and Portal, error rate over time, MCP operations with per-method call counts and success rates, A2A operations with per-capability figures and top agent cards, an hour-of-day by day-of-week request volume heatmap, error distribution and user type distribution.
See the governance posture — including what you don’t govern

Enforcement outcomes, as numbers

Guardrail blocks as a count and as a share of requests, policy denials, PII detections, and how many requests were inspected at all — the difference between “nothing fired” and “nothing was checked”.

Discovery coverage, stated as a fraction

Governed coverage shown as governed assets over discovered assets. A percentage under 100 is the honest headline, and most estates start well under it.

Shadow AI, named and typed

Assets seen by collectors but never routed through Brutor — local AI clients, LLM endpoints, MCP servers, inference runtimes, agent frameworks — each with a confidence score.

Onboard or dismiss, from the list

Every discovered asset carries an action. Shadow AI stops being a report you read and becomes a queue you work through.

Un-approved model spend

Requests to models that are imported, disabled or simply not in your catalog, with what they cost — traffic the gateway never enforced, surfaced so you can decide whether to.

Compliance coverage at a glance

Per-framework counts for EU AI Act, GDPR Article 30, HIPAA, ISO 42001 and SOC 2, showing plainly when a framework isn’t enabled rather than reporting a comfortable zero. Detail in /10/.

The Governance tab of Brutor Analytics: enforcement outcomes showing guardrail blocks, policy denials, PII detections and inspected requests; a shadow AI panel with observed ungoverned spend, un-approved model requests and top un-approved models; discovery coverage as governed assets over discovered assets with an ungoverned count and a breakdown by asset type; a list of top ungoverned assets each with a confidence score and Onboard or Dismiss actions; compliance coverage per framework; and budget and quota breaches.
And take it where you already look

Bring your own observability stack

Native OpenTelemetry hooks feed Prometheus, Grafana, Loki or any OTel-compatible backend you already run — Brutor doesn’t ask to be your only pane of glass.

Alerts with somewhere to go

Usage-limit breaches, unhealthy models and budget thresholds raise alerts with an acknowledgement workflow, and notify an endpoint your team already watches.

Infrastructure health, live

Real-time reachability for every MCP server and AI model, so a failing dependency shows up as a red component rather than as a mysterious rise in error rate.

/Performance Benchmarks · June 2026/

The full enterprise pipeline. No detectable latency cost at tested concurrency.

Every request through Brutor passes auth, RBAC, model routing, governance, cost tracking, quota enforcement, guardrails, and semantic cache lookup — measured against the same models called directly. On the native pipelines, the proxy is statistically indistinguishable from a direct call.

//Median overhead//
≈ 0 ms
Proxy ≤ direct on native pipelines
//Proxy-internal CPU//
< 5 ms
Total per request (Criterion microbench)
//Proxy-introduced errors//
0
100% pass-through reliability
//Governance pipeline//
All on
Every request, no opt-out
See full report

Note: run by the Brutor AI In-House Lab in June 2026 using the benchmarking tool that ships with the proxy. The full per-provider numbers, the honest read on provider variance, methodology, and “run it yourself” instructions are in the linked benchmark report.

/Open standards · Compatibility/

Drop in. No lock-in.

Brutor speaks the protocols your stack already uses. Switch the AI infrastructure beneath your apps without rewriting clients, without inheriting proprietary endpoints, and without giving up the deployment flexibility your security team needs. And the door swings both ways: leaving is a config change, not a migration — your prompts, policies, and history export in standard formats.

OpenAI-compatible API

Drop-in replacement for any OpenAI client. Same SDKs, same wire format. Point at Brutor’s URL and ship.

Native MCP

Full Model Context Protocol support — tools and resources, session management, and multi-server aggregation via Virtual MCP. Works with every MCP-compliant client (Claude Code, Goose, IDE plugins), and we track the evolving MCP specification as it hardens into enterprise infrastructure.

Native A2A v1.0 GA

First-class Agent-to-Agent protocol with signed agent cards, HMAC delegation chains, full task lifecycle. Same governance as LLM traffic.

Deploy anywhere

On-prem · private cloud · Brutor SaaS. Customer-owned data, customer-controlled deployment.

Explore the architecture
The IT Leader's Guide to AI Gateways
Featured article
The IT Leader’s Guide to AI Gateways
Essential reading on AI gateways — what they do, why they matter, and what to look for when choosing one for your organization.
/start the conversation/

AI is everywhere in your organization — your control over it will be too.

Download the free trial, or book a 30-minute demo with our team.

Scroll to Top